Grafana集成
Grafana 是一个开源仪表盘工具,能帮助用户更简单地创建和编辑仪表盘。它可用于Graphite、InfluxDB与 OpenTSDB 一起使用。最新的版本还可以用于其他的数据源,比如 Elasticsearch。
Grafana 集成CA步骤
-
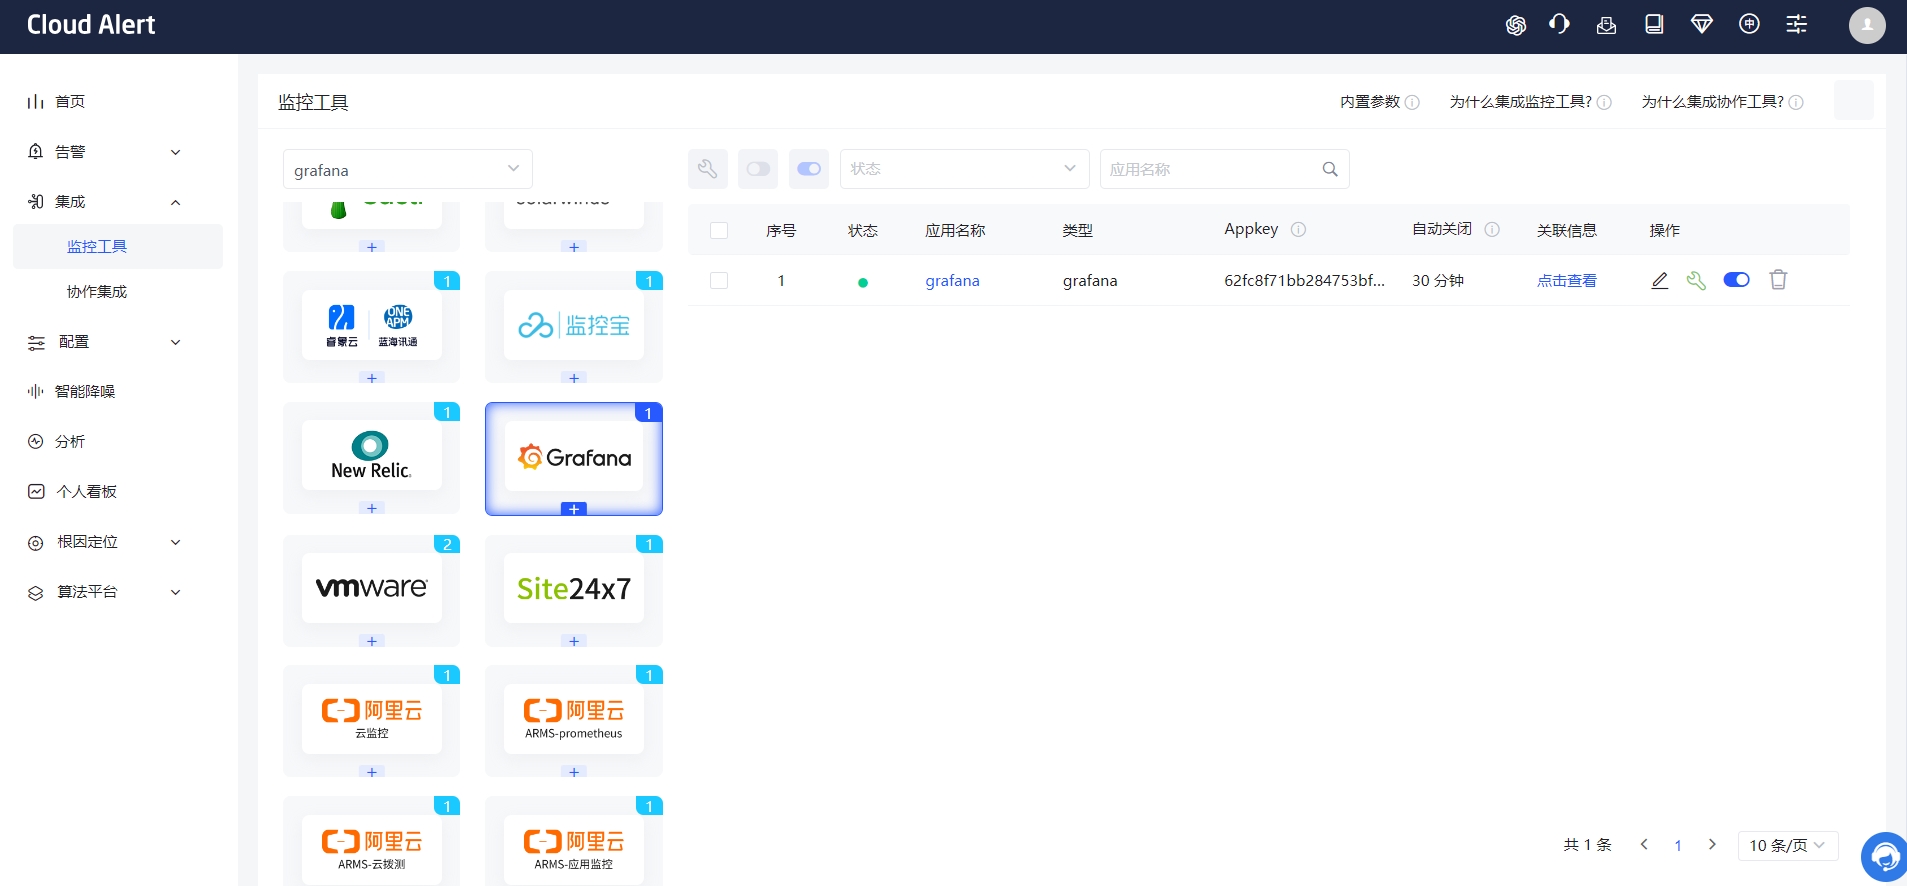
创建应用
在睿象云Cloud Alert界面创建Grafana应用,并获取 appkey 和 回调 URL 。
-
在 Grafana 配置
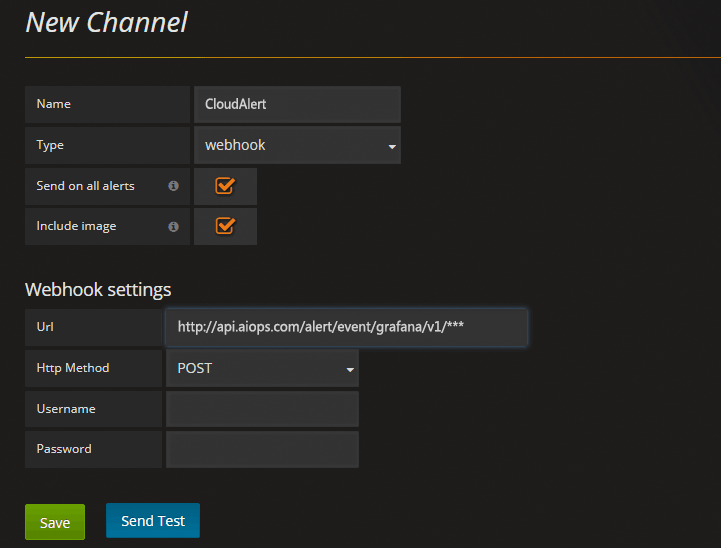
Webhook URL1)在 Grafana 中创建
Notification channel,选择类型为Webhook2)推荐选中
Send on all alerts和Include image,Cloud Alert体验更佳;3)将第一步中生成的
Webhook URL填入Webhook settings Url;# URL格式 http://api.aiops.com/alert/api/event/grafana/v1/--/ --处填入您新建应用时生成的appkey
4)
Http Method选择POST;5)Send Test&Save。
-
将配置的
Webhook Notification Channel添加到 GrafanaAlert中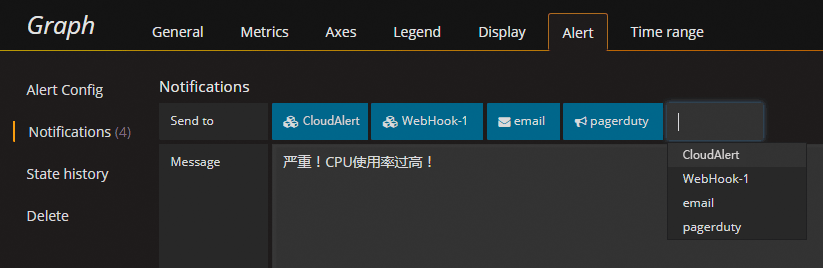
提示
-
Grafana v4.0及以上版本支持配置告警,关于 Grafana Alerting 配置请参考 Grafana Docs
-
如在第二步选中了
Include image选项,并希望在 Cloud Alert 告警中看到 Grafana 中 graph 和 metric values 截图,则需要在 Grafana 配置文件中配置 external_image_storage 及其子模块并重启 Grafana。如在 Cloud Alert 告警中看不到截图,则需要在确认图片存储服务是否可在当前机器访问并在当前浏览器中认证服务。
Grafana V9.0 集成CA步骤
- 创建应用
在睿象云Cloud Alert界面创建Grafana应用,并获取 appkey 和 回调 URL 。
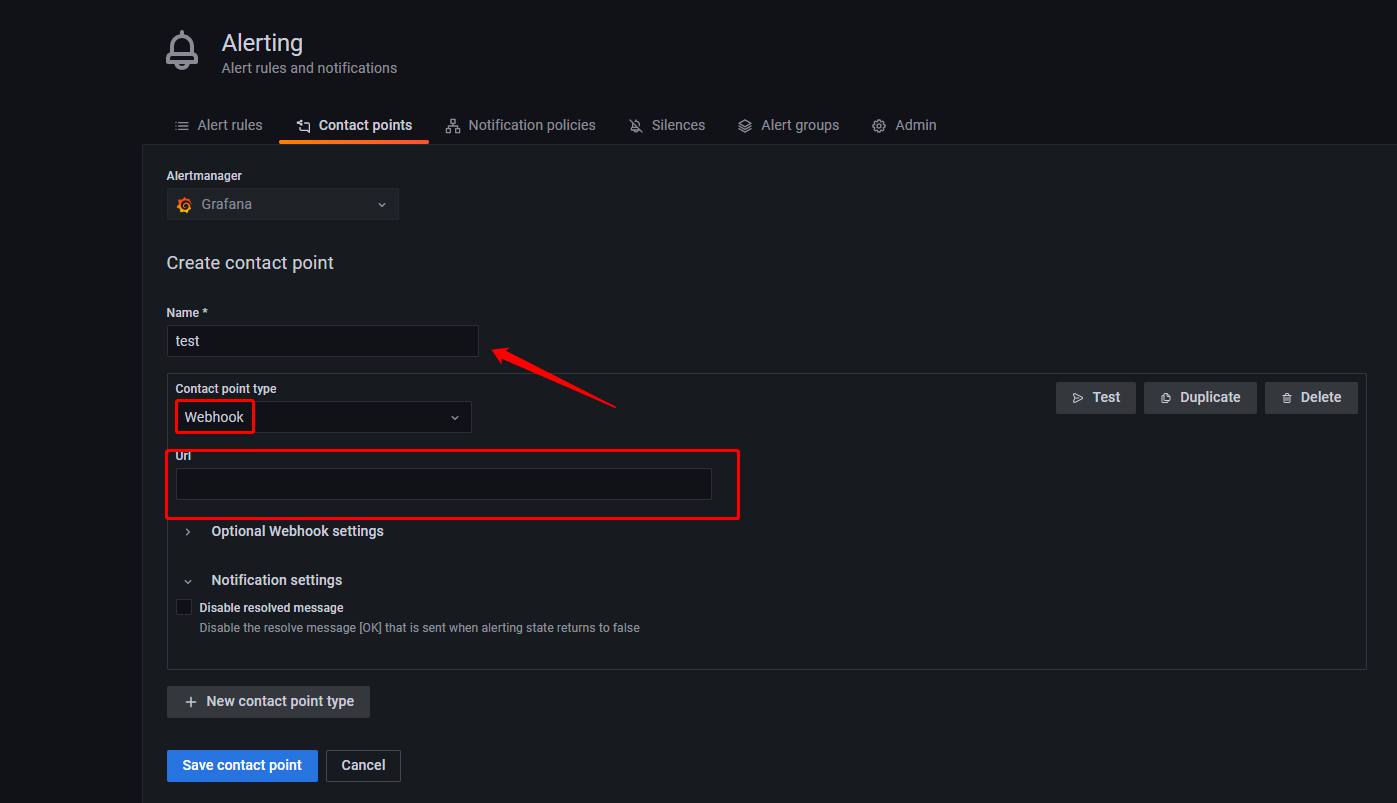
- 创建contact points
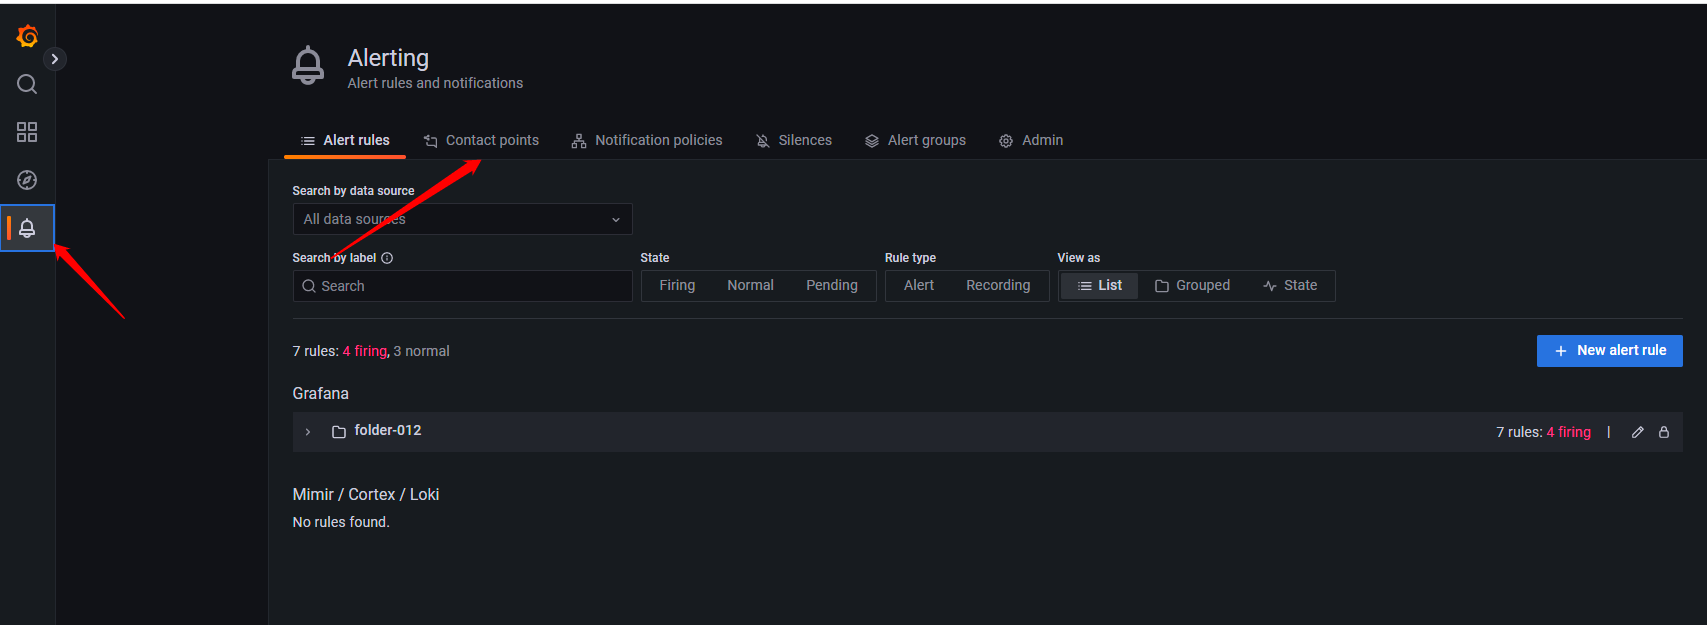
- 填写名称,选择 contact points type为webhook,填写url :http://api.aiops.com/alert/api/event/grafana/v1/{appKey}/
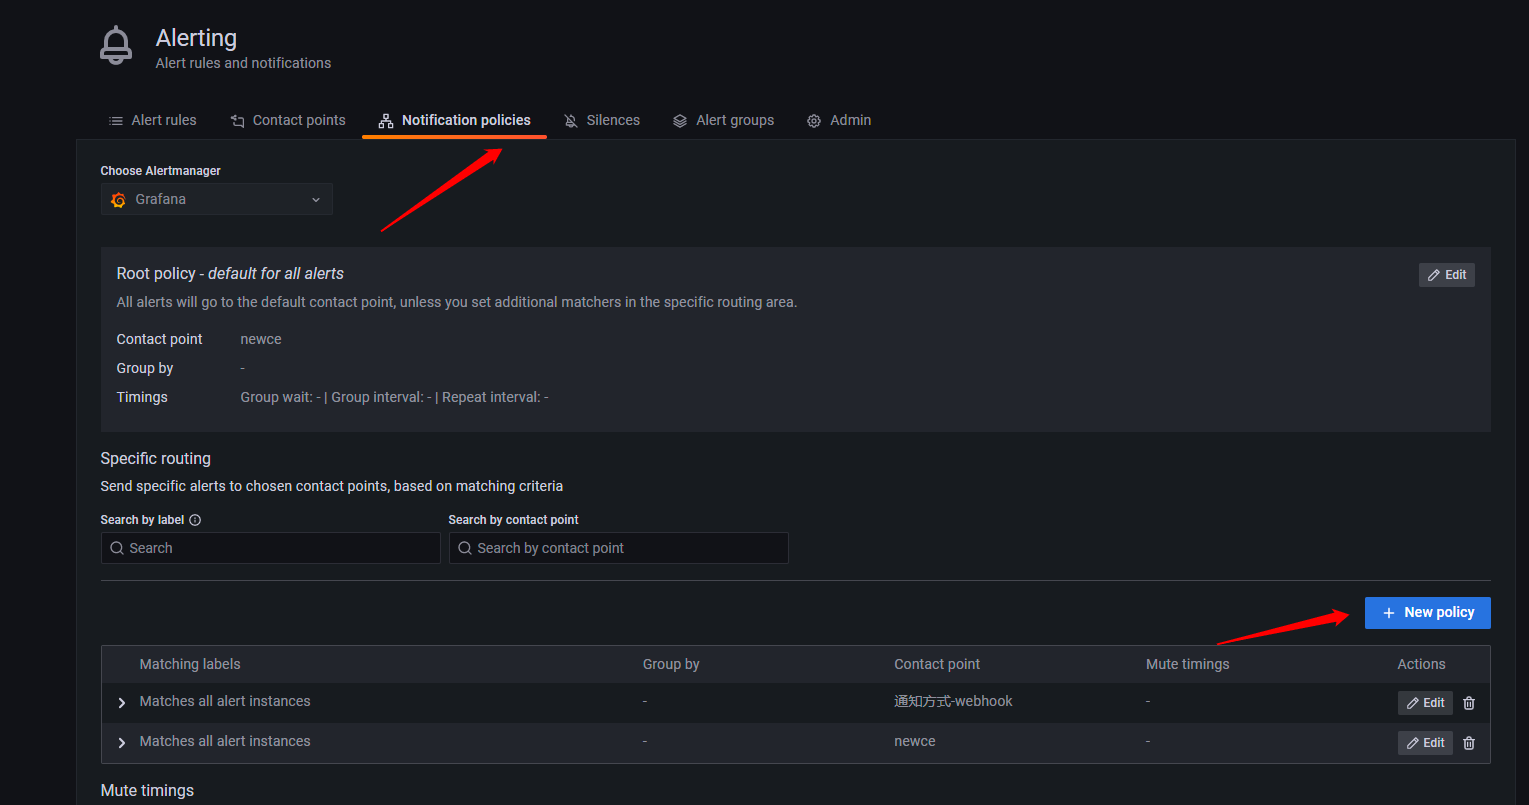
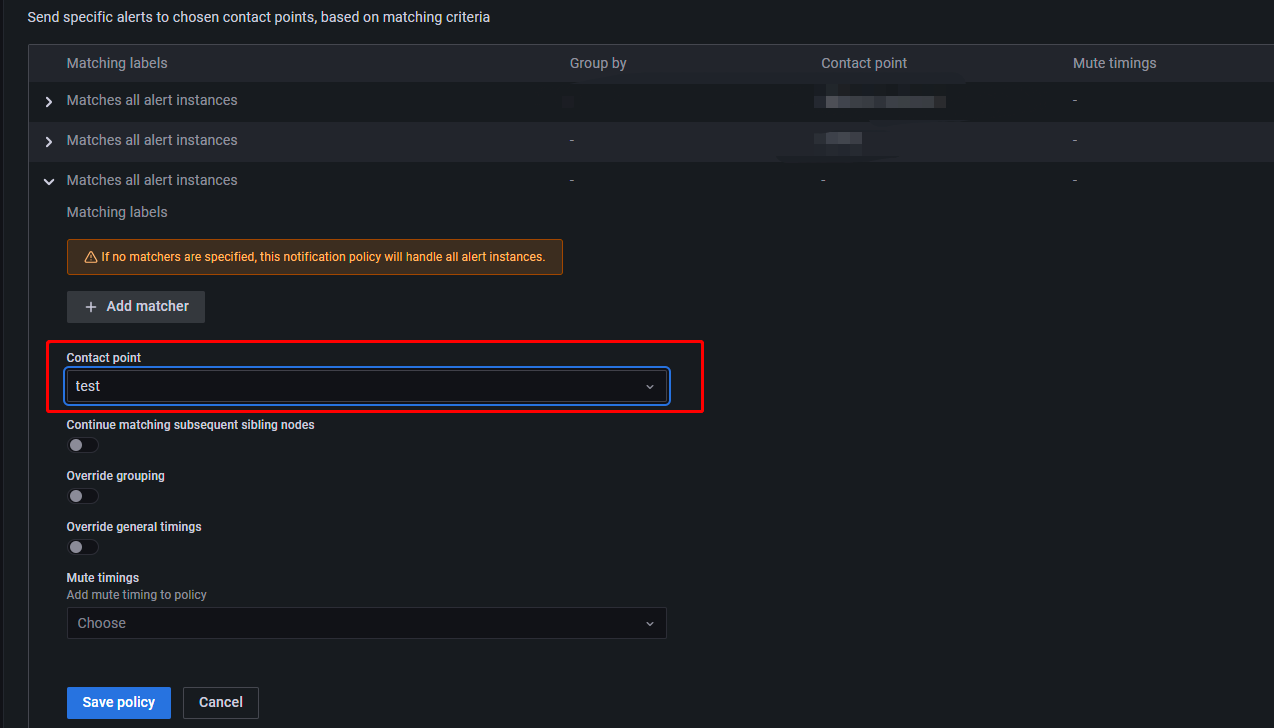
- 创建 Notification policies
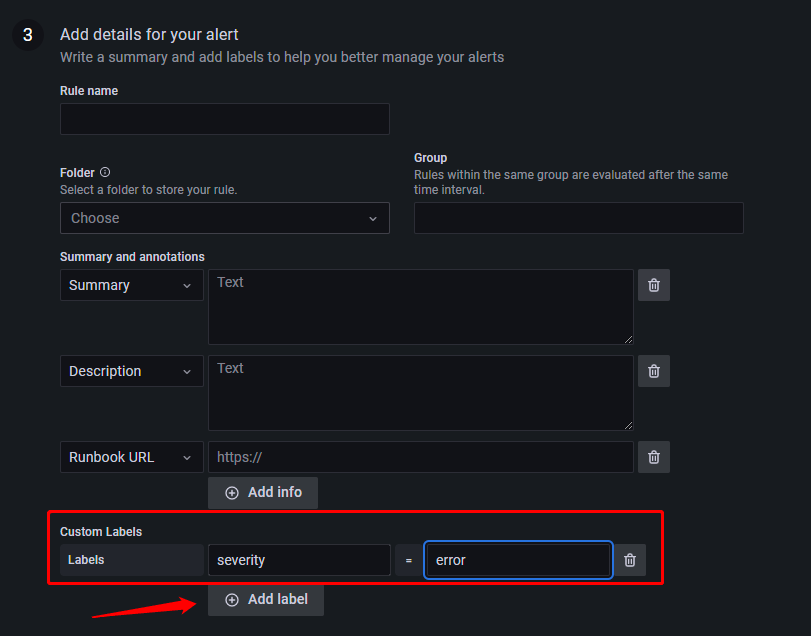
- 配置Alert rules
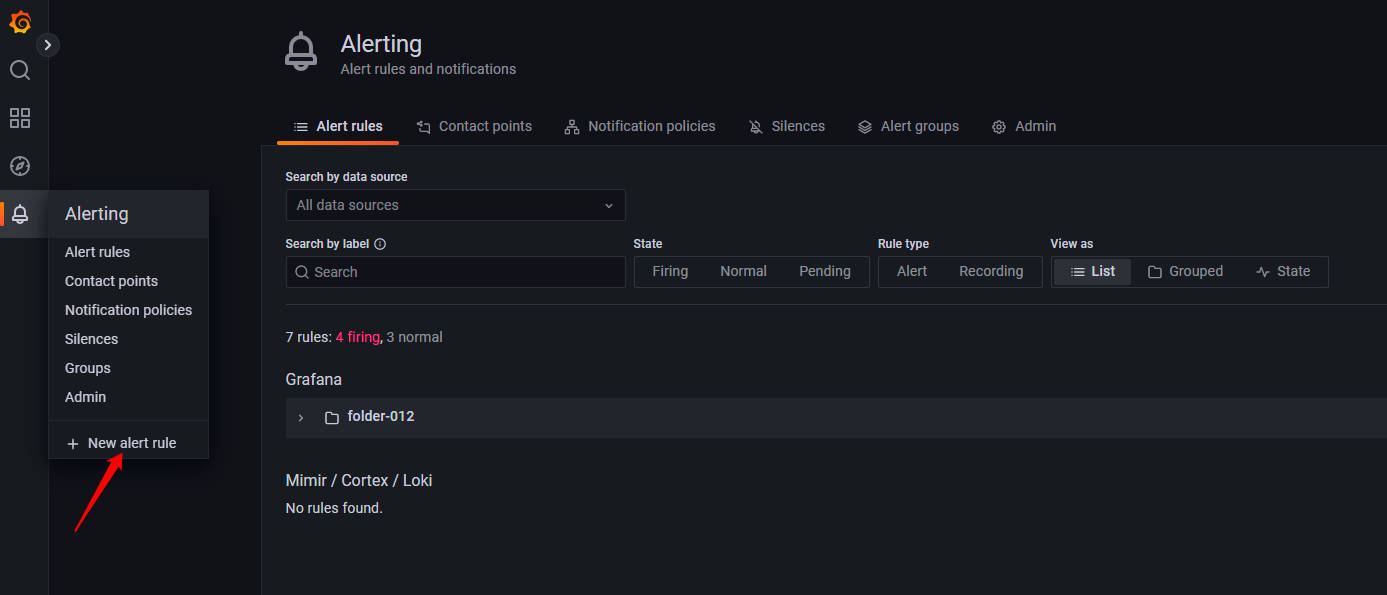
- 添加告警严重性标签severity,指定解析此标签。
集成后收不到告警排错方法
-
Grafana无法配置告警
解决:升级Grafana版本到4.0及以上。
-
配置了Grafana告警,但告警不执行
解决:在Grafana配置文件中alerting模块相关参数配置成true
-
在Cloud Alert中能看到告警,但连接不可访问
解决:在Grafana配置文件中server模块配置可用地址和端口。
-
在Cloud Alert中能看到告警,但图片不可访问
解决:在Grafana配置文件中external_image_storage模块存储服务相关参数,并确保图片存储服务在 当前浏览器能够认证通过。(使用当前浏览器登录,保存密码)
-
进行了以上配置但依然无效
解决:指定更改过的配置文件,重启Grafana。
Grafana与CA告警级别映射关系
| 睿象云 | grafana | grafana9.0 |
|---|---|---|
| 致命 | -- | Critical |
| 严重 | 默认 | Error |
| 警告 | -- | Warn, 默认(v9) |
| 提醒 | -- | Notice |
| 通知 | -- | Info |
| 睿象云 | grafana | grafana9.0 |
|---|---|---|
| 事件ID (eventId) | ruleId | fingerprint |
以上是Grafana告警设置中集成的步骤。