网络(端口)监控
Cloud Insight 通过对 HTTP 监控不同网站 URL 的访问可用性,通过 TCP 监控不同端口的访问可用性。
性能指标
Cloud Insight 采集以下网络(端口)性能指标:
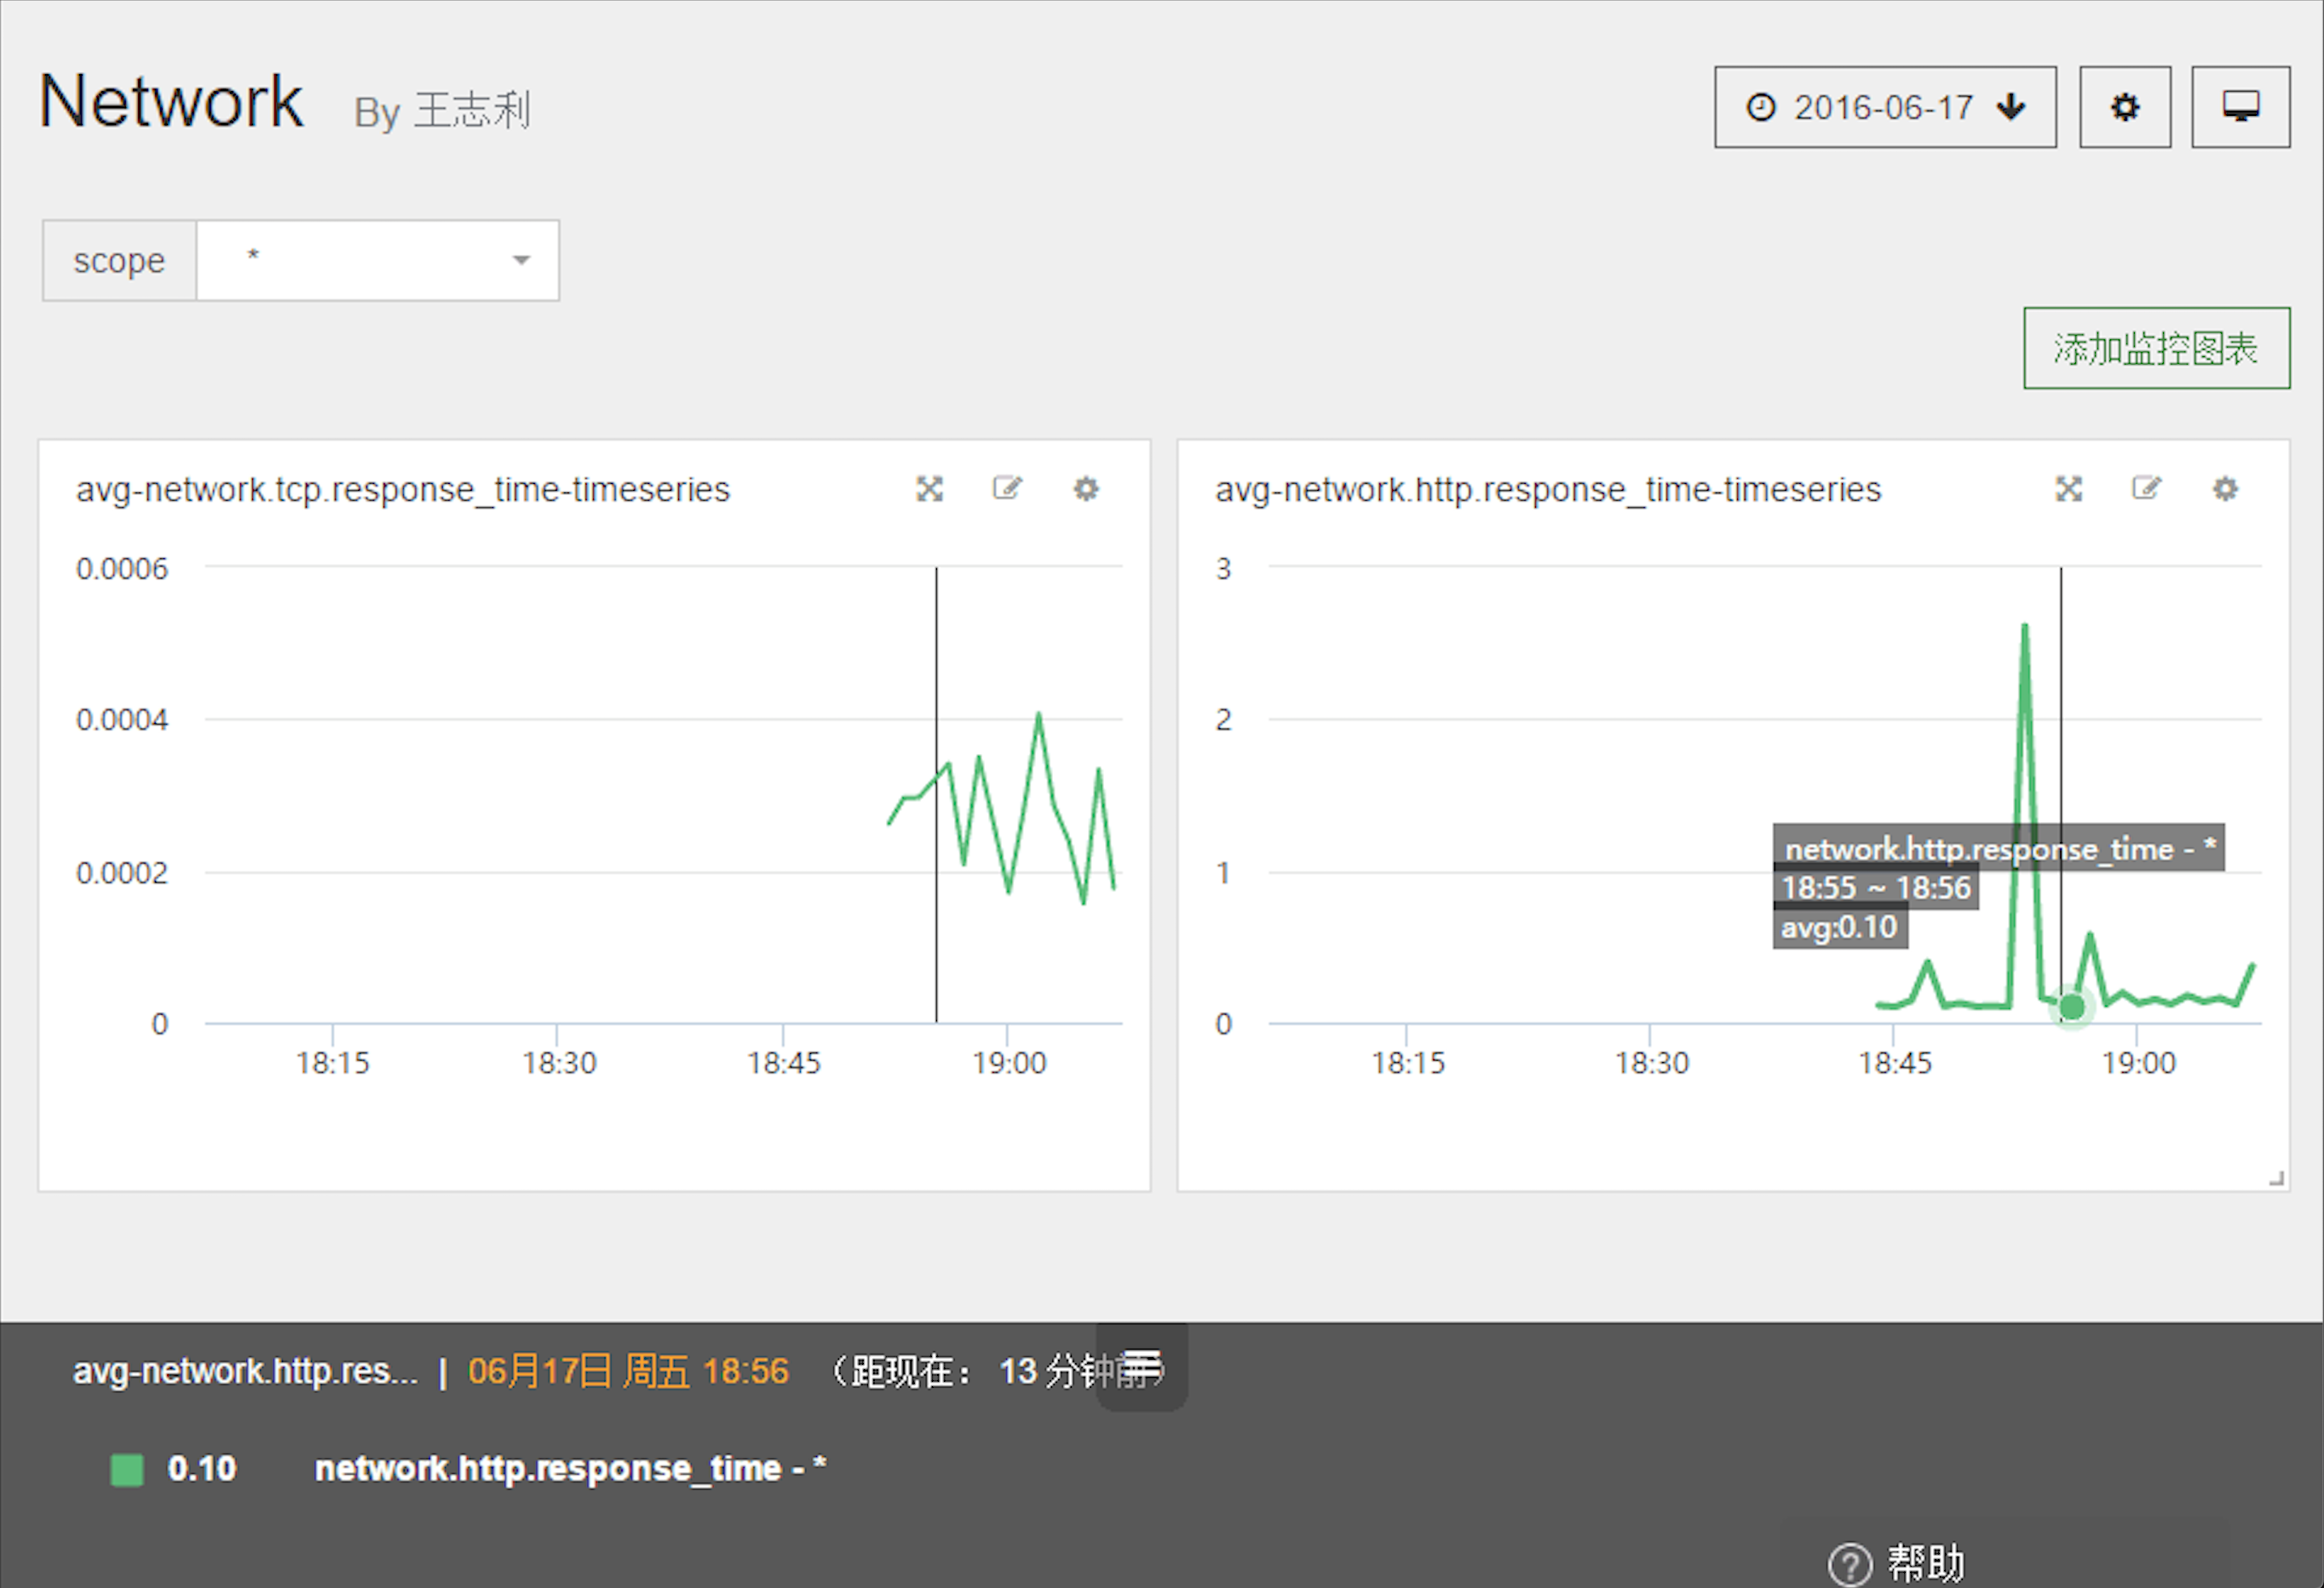
- network.tcp.response_time
- network.http.response_time
配置网络(端口)监控
网络监控默认在安装 Cloud Insight 探针后会自动生成一些网络流量传输的指标,除此之外想要监控特定端口运行情况,还需要特别配置。
目前支持 TCP 和 HTTP(s) 2 种方式,具体配置如下:
切换路径至 /etc/CiAgent。
cd /etc/CiAgent
TCP 连接
开启配置文件 conf.d/tcp_check.yaml
cp conf.d/tcp_check.yaml.example conf.d/tcp_check.yaml
init_config:
instances:
  - name: 10010 port
    host: 127.0.0.1
    port: 10010
    timeout: 1  #  (选填)可以设置超时时间,默认是10s,如果超时,服务关闭
    collect_response_time: true  # 默认不开启,设置端口监控时需要开启,否则没有相应指标生成
HTTP 连接
开启配置文件 conf.d/http_check.yaml
cp conf.d/http_check.yaml.example conf.d/http_check.yaml
init_config:
instances:
  - name: My first service
    url: http://cidc.aiops.com
    timeout: 1
可添加参数:
- username: 如果测试的页面需要认证需要添加此项
- password: 如果测试的页面需要认证需要添加此项
- timeout: 请求超时时间,默认为10s
重启 Agent
重启 Cloud Insight Agent,使配置生效。
您也可以通过查看 Agent Info 信息,来验证配置是否成功。当出现以下信息,则代表安装成功。
tcp_check
---------
  - instance #0 [OK]
  - Collected 1 metric, 0 events & 2 service checks
http_check
----------
  - instance #0 [OK]
  - Collected 1 metric, 0 events & 2 service checks
有关 Agent Info 信息的查看,请访问帮助中心,查看 Cloud Insight Agent 常用操作。
常见问题
- 若要在同一个服务器上监控多个相同的平台服务,参考如何监控多个平台服务。
- 有任何关于产品的使用疑惑,参考常见问题。