ElasticSearch
ElasticSearch 是一个基于 Lucene 的搜索服务器。它基于 RESTful web 接口,提供了一个分布式多用户能力的全文搜索引擎。
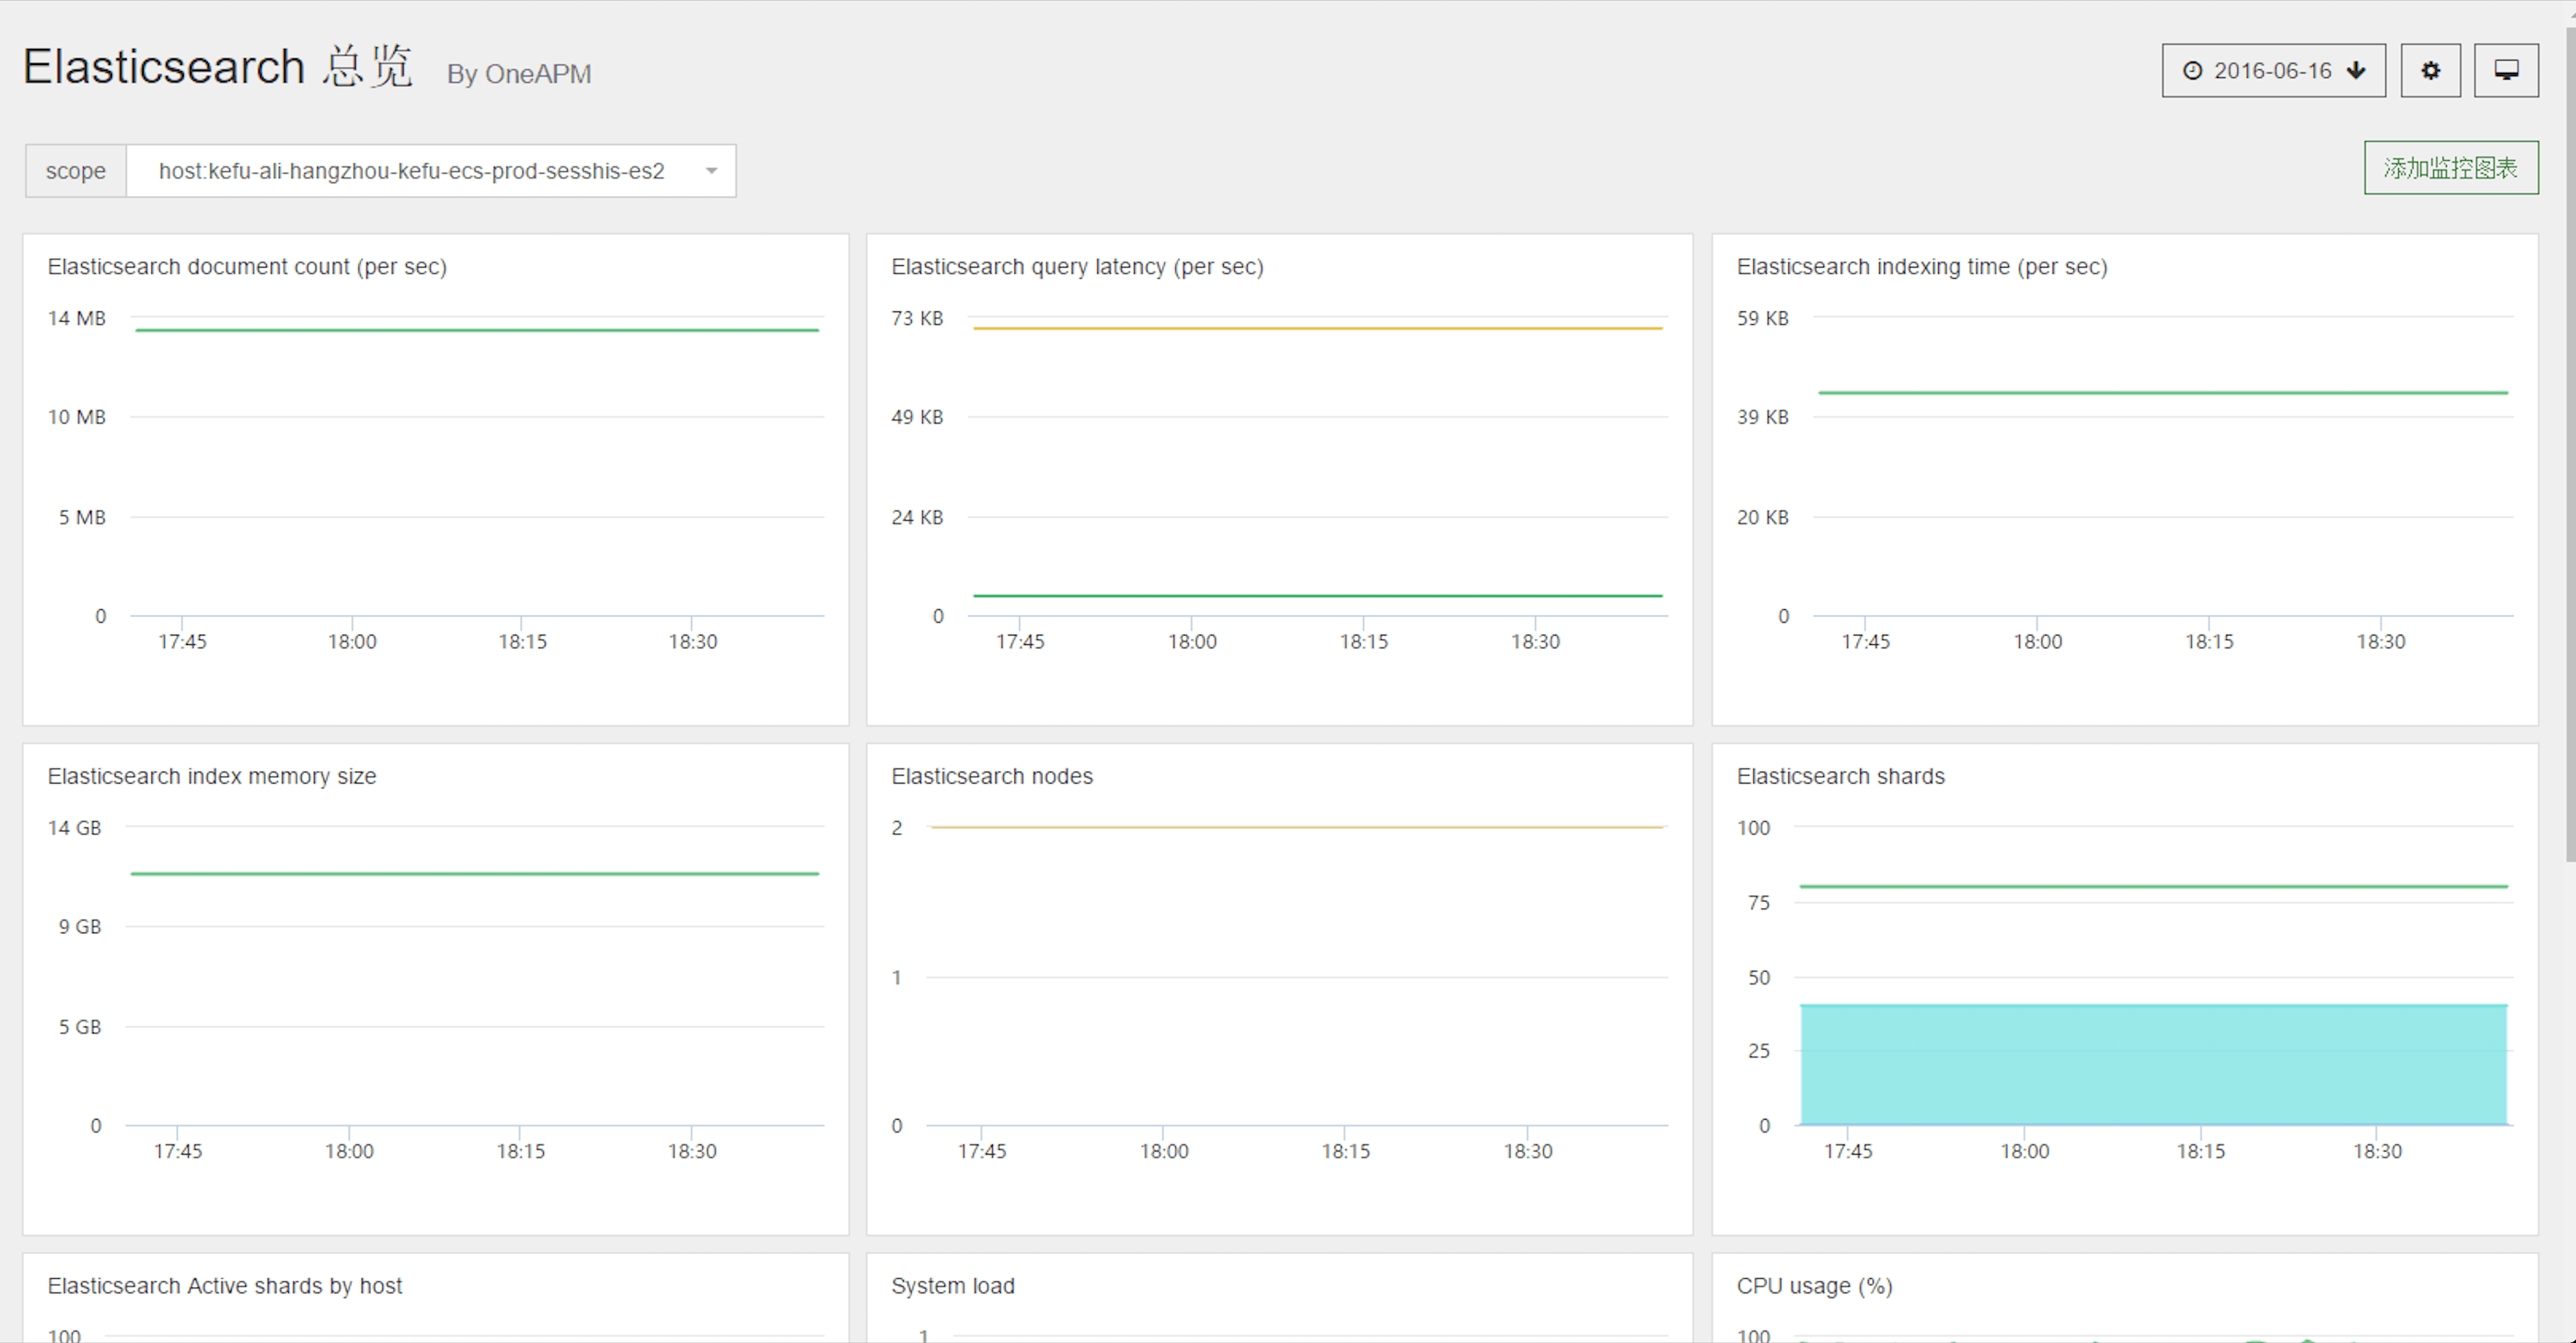
Cloud Insight 监控 ElasticSearch 集群分片情况,操作花费时间等性能状况。
性能指标
Cloud Insight 采集 ElasticSearch 以下性能指标:
| 指标 | 单位 | 具体含义 |
|---|---|---|
| elasticsearch.active_primary_shards | shards | 集群中活跃的主分片数量 |
| elasticsearch.active_shards | shards | 集群中活跃分片数量 |
| elasticsearch.cache.field.evictions | evictions | field 缓存里被驱逐的数据量 |
| elasticsearch.cache.field.size | bytes | field 缓存大小 |
| elasticsearch.cache.filter.count | items | filter 缓存中的 item 数量 |
| elasticsearch.cache.filter.evictions | evictions | filter 缓存里被驱逐的数据量 |
| elasticsearch.cache.filter.size | bytes | filter 缓存大小 |
| elasticsearch.cluster_status | 该 elasticsearch 集群健康数字:红=0,黄色=1,绿=2 | |
| elasticsearch.docs.count | documents | 集群中所有分片的文档数量 |
| elasticsearch.docs.deleted | documents | 集群中所有分片删除的文档数量 |
| elasticsearch.fielddata.evictions | evictions | fielddata 缓存里被驱逐的数据量 |
| elasticsearch.fielddata.size | bytes | fielddata 缓存大小 |
| elasticsearch.flush.total | flushes | 自开始以来,索引 flush 到磁盘的总数量(进行一次提交并删除事务日志的操作叫做 flush) |
| elasticsearch.flush.total.time | seconds | 将索引 flush 到磁盘所用的总时间 |
| elasticsearch.fs.total.available_in_bytes | bytes | 此文件存储上 Java 虚拟机可用的字节总数 |
| elasticsearch.fs.total.disk_io_op | operations | 文件存储上的 I/O 操作的总次数 |
| elasticsearch.fs.total.disk_io_size_in_bytes | bytes | 文件存储上的所有 I/O 操作使用的总字节数 |
| elasticsearch.fs.total.disk_read_size_in_bytes | bytes | 从文件存储读取的总字节数 |
| elasticsearch.fs.total.disk_reads | reads | 从文件存储器读取的总次数 |
| elasticsearch.fs.total.disk_write_size_in_bytes | bytes | 写入文件存储器的总字节数 |
| elasticsearch.fs.total.disk_writes | writes | 写入文件存储器的总次数 |
| elasticsearch.fs.total.free_in_bytes | bytes | 文件存储中未分配字节的总数 |
| elasticsearch.fs.total.total_in_bytes | bytes | 文件存储的总大小 |
| elasticsearch.get.current | requests | 当前正在运行的 get 请求数 |
| elasticsearch.get.exists.time | seconds | 文档存在时花费在 get 请求上的时间 |
| elasticsearch.get.exists.total | requests | 文档存在时 get 请求次数 |
| elasticsearch.get.missing.time | seconds | 文档丢失时花费在 get 请求上的时间 |
| elasticsearch.get.missing.total | requests | 文档丢失时 get 请求次数 |
| elasticsearch.get.time | seconds | 花费在 get 请求上的总时间 |
| elasticsearch.get.total | requests | 总的 get 请求次数 |
| elasticsearch.http.current_open | connections | 当前打开的 http 连接数 |
| elasticsearch.http.total_opened | connections | 打开 http 的总连接数 |
| elasticsearch.id_cache.size | bytes | id 缓存的大小 |
| elasticsearch.indexing.delete.current | documents | 当前从一个 index 中删除的文档数量 |
| elasticsearch.indexing.delete.time | seconds | 从一个 index 中删除文档花费的总时间 |
| elasticsearch.indexing.delete.total | documents | 从一个 index 中删除的文档总数量 |
| elasticsearch.indexing.index.current | documents | 当前从一个 index 中索引的文档数量 |
| elasticsearch.indexing.index.time | seconds | 从一个 index 索引文档所花费的时间 |
| elasticsearch.indexing.index.total | documents | 一个 index 中被索引的文档总数量 |
| elasticsearch.indices.segments.count | segments | 一个 index 分片中的段数 |
| elasticsearch.indices.segments.fixed_bit_set_memory_in_bytes | bytes | 内存中固定位设置使用的大小 |
| elasticsearch.indices.segments.index_writer_max_memory_in_bytes | bytes | 索引编写器使用的最大内存 |
| elasticsearch.indices.segments.index_writer_memory_in_bytes | bytes | 索引编写器使用的内存 |
| elasticsearch.indices.segments.memory_in_bytes | bytes | 索引段使用的内存 |
| elasticsearch.indices.segments.version_map_memory_in_bytes | bytes | 段版本映射使用的内存 |
| elasticsearch.indices.translog.operations | operations | 事务日志中的操作数量 |
| elasticsearch.indices.translog.size_in_bytes | bytes | 事务日志的大小 |
| elasticsearch.initializing_shards | shards | 当前初始化分片的数量 |
| elasticsearch.merges.current | merges | 当前的活跃段合并数量 |
| elasticsearch.merges.current.docs | documents | 当前跨段合并的文档数量 |
| elasticsearch.merges.current.size | bytes | 当前被合并的段的大小 |
| elasticsearch.merges.total | merges | 所有段的合并数量 |
| elasticsearch.merges.total.docs | documents | 跨所有合并段的文档数量 |
| elasticsearch.merges.total.size | bytes | 所有合并段的大小 |
| elasticsearch.merges.total.time | seconds | 花在合并段上的时间 |
| elasticsearch.number_of_data_nodes | nodes | 集群中数据节点总数 |
| elasticsearch.number_of_nodes | nodes | 集群中节点总数 |
| elasticsearch.pending_tasks_priority_high | tasks | 高优先级的未完成的 task 数量 |
| elasticsearch.pending_tasks_priority_urgent | tasks | 紧急优先未完成的 task 数量 |
| elasticsearch.pending_tasks_total | tasks | 总的未完成的 task 数量 |
| elasticsearch.primaries.docs.count | documents | 主分片中的文档总数 |
| elasticsearch.primaries.docs.deleted | documents | 从主分片中删除的文档总数 |
| elasticsearch.primaries.flush.total | flushes | 自从开始以来,从主分片 flush 到磁盘的索引的总次数 |
| elasticsearch.primaries.flush.total.time | seconds | 从主分片 flush 索引到磁盘花费的总时间 |
| elasticsearch.primaries.get.current | requests | 主分片上当前正在运行的 get 请求数 |
| elasticsearch.primaries.get.exists.time | requests | 从文档存在的主分片 get 请求所花费的总时间 |
| elasticsearch.primaries.get.exists.total | requests | 文档存在的主分片上的 get 请求总数 |
| elasticsearch.primaries.get.missing.time | seconds | 从文档丢失的主分片 get 请求所花费的总时间 |
| elasticsearch.primaries.get.missing.total | requests | 文档丢失的主分片上的 get 请求总数 |
| elasticsearch.primaries.get.time | seconds | 从主分片 get 请求所花费的总时间 |
| elasticsearch.primaries.get.total | requests | 从主分片 get 请求的总次数 |
| elasticsearch.primaries.indexing.delete.current | documents | 当前正从主分片上的一个 index 中删除的文档数 |
| elasticsearch.primaries.indexing.delete.time | seconds | 从主分片上的一个 index 中删除文档所花费的总时间 |
| elasticsearch.primaries.indexing.delete.total | documents | 从主分片上的一个 index 中删除的文档总数 |
| elasticsearch.primaries.indexing.index.current | documents | 当前正从主分片上的一个 index 中索引的文档数 |
| elasticsearch.primaries.indexing.index.time | seconds | 主分片上一个 index 索引文档所花费的总时间 |
| elasticsearch.primaries.indexing.index.total | documents | 主分片上一个 index 索引文档的总数量 |
| elasticsearch.primaries.merges.current | merges | 主分片上当前的活跃段合并数量 |
| elasticsearch.primaries.merges.current.docs | documents | 主分片上当前跨段合并的文档数量 |
| elasticsearch.primaries.merges.current.size | bytes | 主分片上当前被合并的段的大小 |
| elasticsearch.primaries.merges.total | merges | 主分片上所有段的合并数量 |
| elasticsearch.primaries.merges.total.docs | documents | 主分片上跨所有合并段的文档数量 |
| elasticsearch.primaries.merges.total.size | bytes | 主分片上所有合并段的大小 |
| elasticsearch.primaries.merges.total.time | seconds | 主分片上花在合并段上的时间 |
| elasticsearch.primaries.refresh.total | refreshes | 主分片上 index 刷新总数量 |
| elasticsearch.primaries.refresh.total.time | seconds | 主分片上 index 刷新花费的总时间 |
| elasticsearch.primaries.search.fetch.current | fetches | 当前运行在主分片上查询取回操作的数量 |
| elasticsearch.primaries.search.fetch.time | seconds | 在主分片上查询取回操作的总时间 |
| elasticsearch.primaries.search.fetch.total | fetches | 在主分片上查询取回操作的总数量 |
| elasticsearch.primaries.search.query.current | queries | 当前运行在主分片上查询操作的数量 |
| elasticsearch.primaries.search.query.time | seconds | 在主分片上查询操作的总时间 |
| elasticsearch.primaries.search.query.total | queries | 在主分片上查询操作的数量 |
| elasticsearch.primaries.store.size | bytes | 所有主分片的总大小 |
| elasticsearch.process.open_fd | files | 打开和当前进程相关的文件描述符的数量,如果不支持,则为 -1 |
| elasticsearch.refresh.total | refreshes | 索引刷新的总次数 |
| elasticsearch.refresh.total.time | seconds | 索引刷新花费的总时间 |
| elasticsearch.relocating_shards | shards | 从一个节点搬到另一个节点的分片数量 |
| elasticsearch.search.fetch.current | fetches | 当前运行的搜索返回操作的数量 |
| elasticsearch.search.fetch.open_contexts | queries | 活跃的搜索数量 |
| elasticsearch.search.fetch.time | seconds | 在搜索返回操作上花费的总时间 |
| elasticsearch.search.fetch.total | fetches | 搜索返回操作总数量 |
| elasticsearch.search.query.current | queries | 当前运行的查询操作的数量 |
| elasticsearch.search.query.time | seconds | 在查询操作上花费的总时间 |
| elasticsearch.search.query.total | queries | 查询的操作的总数量 |
| elasticsearch.store.size | bytes | 存储的总大小 |
| elasticsearch.thread_pool.bulk.active | threads | bulk 线程池中的活跃线程数 |
| elasticsearch.thread_pool.bulk.queue | threads | bulk 线程池中的排队线程数 |
| elasticsearch.thread_pool.bulk.rejected | threads | bulk 线程池中被拒绝的线程数 |
| elasticsearch.thread_pool.bulk.threads | threads | bulk 线程池中线程总数 |
| elasticsearch.thread_pool.flush.active | threads | flush 线程池中的活跃线程数 |
| elasticsearch.thread_pool.flush.queue | threads | flush 线程池中的排队线程数 |
| elasticsearch.thread_pool.flush.threads | threads | flush 线程池中线程总数 |
| elasticsearch.thread_pool.generic.active | threads | generic 线程池中的活跃线程数 |
| elasticsearch.thread_pool.generic.queue | threads | generic 线程池中的排队线程数 |
| elasticsearch.thread_pool.generic.threads | threads | generic 线程池中线程总数 |
| elasticsearch.thread_pool.get.active | threads | get 线程池中的活跃线程数 |
| elasticsearch.thread_pool.get.queue | threads | get 线程池中的排队线程数 |
| elasticsearch.thread_pool.get.threads | threads | get 线程池中线程总数 |
| elasticsearch.thread_pool.index.active | threads | index 线程池中的活跃线程数 |
| elasticsearch.thread_pool.index.queue | threads | index 线程池中的排队线程数 |
| elasticsearch.thread_pool.index.threads | threads | index 线程池中线程总数 |
| elasticsearch.thread_pool.management.active | threads | management 线程池中的活跃线程数 |
| elasticsearch.thread_pool.management.queue | threads | management 线程池中的排队线程数 |
| elasticsearch.thread_pool.management.threads | threads | management 线程池中线程总数 |
| elasticsearch.thread_pool.merge.active | threads | merge 线程池中的活跃线程数 |
| elasticsearch.thread_pool.merge.queue | threads | merge 线程池中的排队线程数 |
| elasticsearch.thread_pool.merge.threads | threads | merge 线程池中线程总数 |
| elasticsearch.thread_pool.percolate.active | threads | percolate 线程池中的活跃线程数 |
| elasticsearch.thread_pool.percolate.queue | threads | percolate 线程池中的排队线程数 |
| elasticsearch.thread_pool.percolate.threads | threads | percolate 线程池中线程总数 |
| elasticsearch.thread_pool.refresh.active | threads | refresh 线程池中的活跃线程数 |
| elasticsearch.thread_pool.refresh.queue | threads | refresh 线程池中的排队线程数 |
| elasticsearch.thread_pool.refresh.threads | threads | refresh 线程池中线程总数 |
| elasticsearch.thread_pool.search.active | threads | search 线程池中的活跃线程数 |
| elasticsearch.thread_pool.search.queue | threads | search 线程池中的排队线程数 |
| elasticsearch.thread_pool.search.threads | threads | search 线程池中线程总数 |
| elasticsearch.thread_pool.snapshot.active | threads | snapshot 线程池中的活跃线程数 |
| elasticsearch.thread_pool.snapshot.queue | threads | snapshot 线程池中的排队线程数 |
| elasticsearch.thread_pool.snapshot.threads | threads | snapshot 线程池中线程总数 |
| elasticsearch.transport.rx_count | packets | 集群通信中接收的数据包总数 |
| elasticsearch.transport.rx_size | bytes | 集群通信中接收的数据的总大小 |
| elasticsearch.transport.server_open | connections | 为集群通信打开的连接数 |
| elasticsearch.transport.tx_count | packets | 集群通信中发送的数据包总数 |
| elasticsearch.transport.tx_size | bytes | 集群通信中发送的数据的总大小 |
| elasticsearch.unassigned_shards | shards | 未分配给节点的分片数量 |
| jvm.gc.collection_count | garbage collections | JVM 运行的垃圾回收的总次数 |
| jvm.gc.collection_time | seconds | 在 JVM 中进行垃圾回收所花费的总时间 |
| jvm.gc.collectors.old.collection_time | seconds | JVM 中花费在 Old GC 上的总时间(即 Major GC) |
| jvm.gc.collectors.old.count | garbage collections | JVM 中 Old GC 总次数(即 Major GC) |
| jvm.gc.collectors.young.collection_time | seconds | JVM 中花费在 Young GC 上的总时间(即 Minor GC) |
| jvm.gc.collectors.young.count | garbage collections | JVM 中 Young GC 总次数(即 Minor GC) |
| jvm.gc.concurrent_mark_sweep.collection_time | seconds | JVM 中花费在 CMS GC 上的总时间 |
| jvm.gc.concurrent_mark_sweep.count | garbage collections | JVM 中 CMS GC 的总次数 |
| jvm.gc.par_new.collection_time | seconds | JVM 中花费在 ParNew GC 上的总时间 |
| jvm.gc.par_new.count | garbage collections | JVM 中 ParNew GC 的总次数 |
| jvm.mem.heap_committed | bytes | 保证可用于 JVM 堆的内存量 |
| jvm.mem.heap_in_use | JVM 堆当前使用的内存量化为 0 到 1 之间的值 | |
| jvm.mem.heap_max | bytes | JVM 堆可以使用的最大内存量 |
| jvm.mem.heap_used | bytes | JVM 堆当前使用的内存量 |
| jvm.mem.non_heap_committed | bytes | 保证可用于 JVM 非堆的内存量 |
| jvm.mem.non_heap_used | bytes | JVM 中非堆内存使用量 |
| jvm.threads.count | threads | JVM 中活动线程的数量 |
| jvm.threads.peak_count | threads | JVM 使用的线程的峰值数 |
配置 Elastic Search 监控
编辑配置文件
编辑配置文件 conf.d/elastic.yaml,使 Cloud Insight Agent 可以与 Elasticsearch 通信。
init_config:

instances:
  - url: http://localhost:9200
重启 Agent
重启 Cloud Insight Agent,使配置生效。
您也可以通过查看 Agent Info 信息,来验证配置是否成功。当出现以下信息,则代表安装成功。
Checks
======

[...]

elastic
------
  - instance #0 [OK]
  - Collected 8 metrics & 0 events
有关 Agent Info 信息的查看,请访问帮助中心,查看 Cloud Insight Agent 常用操作。
常见问题
- 若要在同一个服务器上监控多个相同的平台服务,参考如何监控多个平台服务。
- 有任何关于产品的使用疑惑,参考常见问题。