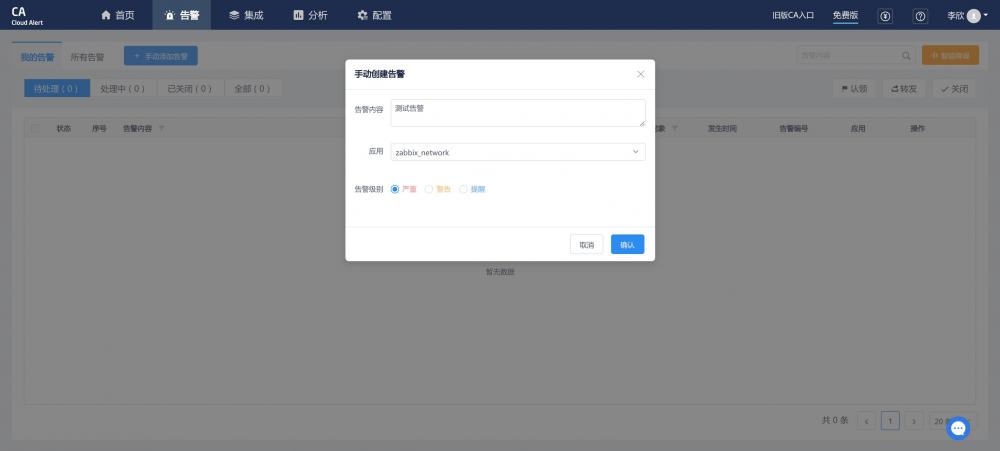
如何在智能告警平台CA触发测试告警
959
2022-10-14
ELK基础架构解说-运维笔记
一、ELK日志分析工具介绍1) Elasticsearch1.1) Elasticsearch介绍ElasticSearch是一个基于Lucene的搜索服务器。它提供了一个分布式多用户能力的全文搜索引擎,基于RESTful web接口。Elasticsearch是用Java开发的,并作为Apache许可条款下的开放源码发布,是第二流行的企业搜索引擎。设计用于云计算中,能够达到实时搜索,稳定,可靠,快速,安装使用方便。
1.2) Elasticsearch几个重要术语- NRT elasticsearch是一个近似实时的搜索平台,从索引文档到可搜索有些延迟,通常为1秒。- 集群 集群就是一个或多个节点存储数据,其中一个节点为主节点,这个主节点是可以通过选举产生的,并提供跨节点的联合索引和搜索的功能。集群有一个唯一性标示的名字,默认是elasticsearch,集群名字很重要,每个节点是基于集群名字加入到其集群中的。因此,确保在不同环境中使用不同的集群名字。一个集群可以只有一个节点。强烈建议在配置elasticsearch时,配置成集群模式。- 节点 节点就是一台单一的服务器,是集群的一部分,存储数据并参与集群的索引和搜索功能。像集群一样,节点也是通过名字来标识,默认是在节点启动时随机分配的字符名。当然啦,你可以自己定义。该名字也蛮重要的,在集群中用于识别服务器对应的节点。 节点可以通过指定集群名字来加入到集群中。默认情况下,每个节点被设置成加入到elasticsearch集群。如果启动了多个节点,假设能自动发现对方,他们将会自动组建一个名为elasticsearch的集群。- 索引 索引是有几分相似属性的一系列文档的集合。如nginx日志索引、syslog索引等等。索引是由名字标识,名字必须全部小写。这个名字用来进行索引、搜索、更新和删除文档的操作。 索引相对于关系型数据库的库。- 类型 在一个索引中,可以定义一个或多个类型。类型是一个逻辑类别还是分区完全取决于你。通常情况下,一个类型被定于成具有一组共同字段的文档。如ttlsa运维生成时间所有的数据存入在一个单一的名为logstash-ttlsa的索引中,同时,定义了用户数据类型,帖子数据类型和评论类型。 类型相对于关系型数据库的表。- 文档 文档是信息的基本单元,可以被索引的。文档是以JSON格式表现的。 在类型中,可以根据需求存储多个文档。 虽然一个文档在物理上位于一个索引,实际上一个文档必须在一个索引内被索引和分配一个类型。 文档相对于关系型数据库的列。- 分片和副本 在实际情况下,索引存储的数据可能超过单个节点的硬件限制。如一个十亿文档需1TB空间可能不适合存储在单个节点的磁盘上,或者从单个节点搜索请求太慢了。为了解决这个问题,elasticsearch提供将索引分成多个分片的功能。当在创建索引时,可以定义想要分片的数量。每一个分片就是一个全功能的独立的索引,可以位于集群中任何节点上。 分片的两个最主要原因: a) 水平分割扩展,增大存储量;b) 分布式并行跨分片操作,提高性能和吞吐量;
分布式分片的机制和搜索请求的文档如何汇总完全是有elasticsearch控制的,这些对用户而言是透明的。 网络问题等等其它问题可以在任何时候不期而至,为了健壮性,强烈建议要有一个故障切换机制,无论何种故障以防止分片或者节点不可用。 为此,elasticsearch让我们将索引分片复制一份或多份,称之为分片副本或副本。 副本也有两个最主要原因: a) 高可用性,以应对分片或者节点故障。出于这个原因,分片副本要在不同的节点上。 b) 提供性能,增大吞吐量,搜索可以并行在所有副本上执行。 总之,每一个索引可以被分成多个分片。索引也可以有0个或多个副本。复制后,每个索引都有主分片(母分片)和复制分片(复制于母分片)。分片和副本数量可以在每个索引被创建时定义。索引创建后,可以在任何时候动态的更改副本数量,但是,不能改变分片数。 默认情况下,elasticsearch为每个索引分片5个主分片和1个副本,这就意味着集群至少需要2个节点。索引将会有5个主分片和5个副本(1个完整副本),每个索引总共有10个分片。 每个elasticsearch分片是一个Lucene索引。一个单个Lucene索引有最大的文档数LUCENE-5843, 文档数限制为2147483519(MAX_VALUE – 128)。 可通过_cat/shards来监控分片大小。
2) Logstash2.1) Logstash 介绍LogStash由JRuby语言编写,基于消息(message-based)的简单架构,并运行在Java虚拟机(JVM)上。不同于分离的代理端(agent)或主机端(server),LogStash可配置单一的代理端(agent)与其它开源软件结合,以实现不同的功能。
2.2) LogStash的四大组件Shipper:发送事件(events)至LogStash;通常,远程代理端(agent)只需要运行这个组件即可;Broker and Indexer:接收并索引化事件;Search and Storage:允许对事件进行搜索和存储;Web Interface:基于Web的展示界面 正是由于以上组件在LogStash架构中可独立部署,才提供了更好的集群扩展性。
2.3) LogStash主机分类代理主机(agent host):作为事件的传递者(shipper),将各种日志数据发送至中心主机;只需运行Logstash 代理(agent)程序;中心主机(central host):可运行包括中间转发器(Broker)、索引器(Indexer)、搜索和存储器(Search and Storage)、Web界面端(Web Interface)在内的各个组件,以实现对日志数据的接收、处理和存储。
3) KibanaLogstash是一个完全开源的工具,他可以对你的日志进行收集、分析,并将其存储供以后使用(如,搜索),您可以使用它。说到搜索,logstash带有一个web界面,搜索和展示所有日志。
二、使用ELK日志分析工具的必要性(解决运维痛点)- 开发人员不能登录线上服务器查看详细日志;- 各个系统都有日志,日志数据分散难以查找;- 日志数据量大,查询速度慢,或者数据不够实时;
三、ELK日志分析环境部署1) 准备机器
两台虚拟机:hostname:linux-node1 和 linux-node2 ip地址:192.168.56.11 和 192.168.56.22
2) 系统环境(两台完全一致)
[root@linux-node2 ~]# cat /etc/redhat-release CentOS Linux release 7.1.1503 (Core) [root@linux-node2 ~]# uname -aLinux linux-node2 3.10.0-229.el7.x86_64 #1 SMP Fri Mar 6 11:36:42 UTC 2015 x86_64 x86_64 x86_64 GNU/Linux[root@linux-node2 ~]# cat /etc/hosts127.0.0.1 localhost localhost.localdomain localhost4 localhost4.localdomain4::1 localhost localhost.localdomain localhost6 localhost6.localdomain6192.168.56.11 linux-node1.oldboyedu.com linux-node1192.168.56.12 linux-node2.oldboyedu.com linux-node2
3) elk准备环境(两台完全一致)
4) 管理配置elasticsearch4.1) 管理linux-node1的elasticsearch
访问9200端口,会把信息显示出来
elasticsearch进行交互
在插件中添加一个index-demo/test的索引,提交请求
发送一个GET(当然可以使用其他类型请求)请求,查询上述索引id
在基本查询中查看所建索引
4.2) 管理linux-node2的elasticsearch将linux-node1的配置文件拷贝到linux-node2中,并修改配置文件并授权配置文件中cluster.name的名字一定要一致,当集群内节点启动的时候,默认使用组播(多播),寻找集群中的节点:
在浏览器中查看分片信息,一个索引默认被分成了5个分片,每份数据被分成了五个分片(可以调节分片数量),下图中外围带绿色框的为主分片,不带框的为副本分片,主分片丢失,副本分片会复制一份成为主分片,起到了高可用的作用,主副分片也可以使用负载均衡加快查询速度,但是如果主副本分片都丢失,则索引就是彻底丢失。
4.3) 使用kopf插件监控elasticsearch
[root@linux-node1 bin]# /usr/share/elasticsearch/bin/plugin install lmenezes/elasticsearch-kopf
从下图可以看出节点的负载,cpu适应情况,java对内存的使用(heap usage),磁盘使用,启动时间
除此之外,kopf插件还提供了REST API 等,类似kopf插件的还有bigdesk,但是bigdesk目前还不支持2.1!!安装bigdesk的方法如下:
# /usr/share/elasticsearch/bin/plugin install lukas-vlcek/bigdesk
4.4) node间组播通信和分片当第一个节点启动,它会组播发现其他节点,发现集群名字一样的时候,就会自动加入集群。随便一个节点都是可以连接的,并不是主节点才可以连接,连接的节点起到的作用只是汇总信息展示:
最初可以自定义设置分片的个数,分片一旦设置好,就不可以改变。主分片和副本分片都丢失,数据即丢失,无法恢复,可以将无用索引删除。有些老索引或者不常用的索引需要定期删除,否则会导致es资源剩余有限,占用磁盘大,搜索慢等。如果暂时不想删除有些索引,可以在插件中关闭索引,就不会占用内存了。
5) 配置Logstash5.1) 循序渐进学习Logstash启动一个logstash, 其中-e:在命令行执行;input输入,stdin标准输入,是一个插件;output输出,stdout:标准输出
使用rubudebug显示详细输出,codec为一种编解码器
[root@linux-node1 bin]# /opt/logstash/bin/logstash -e 'input { stdin{} } output { stdout{ codec => rubydebug} }'Settings: Default filter workers: 1Logstash startup completedchuck ==>输入{ "message" => "chuck", "@version" => "1", "@timestamp" => "2016-01-14T06:07:50.117Z", "host" => "linux-node1"} ==>使用rubydebug输出
上述每一条输出的内容称为一个事件,多个相同的输出的内容合并到一起称为一个事件(举例:日志中连续相同的日志输出称为一个事件)! 使用logstash将信息写入到elasticsearch
在elasticsearch中查看logstash新加的索引
在elasticsearch中写一份,同时在本地输出一份,也就是在本地保留一份文本文件,也就不用在elasticsearch中再定时备份到远端一份了。此处使用的保留文本文件三大优势:1)文本最简单; 2) 文本可以二次加工; 3) 文本的压缩比最高;
使用logstash启动一个配置文件,会在elasticsearch中写一份
[root@linux-node1 ~]# cat normal.conf input { stdin { } }output { elasticsearch { hosts => ["localhost:9200"] } stdout { codec => rubydebug }}[root@linux-node1 ~]# /opt/logstash/bin/logstash -f normal.confSettings: Default filter workers: 1Logstash startup completed123{ "message" => "123", "@version" => "1", "@timestamp" => "2016-01-14T06:51:13.411Z", "host" => "linux-node1
5.2) 学习编写conf格式- 输入插件配置,此处以file为例,可以设置多个
input { file { path => "/var/log/messages" type => "syslog" } file { path => "/var/log/apache/access.log" type => "apache" }}
- 介绍几种收集文件的方式,可以使用数组方式或者用*匹配,也可以写多个path
path => ["/var/log/messages","/var/log/*.log"]path => ["/data/mysql/mysql.log"]
- 设置boolean值
ssl_enable => true
- 文件大小单位
my_bytes => "1113" # 1113 bytesmy_bytes => "10MiB"# 10485760 bytesmy_bytes => "100kib" # 102400 bytesmy_bytes => "180 mb" # 180000000 bytes
- jason收集
codec => “json”
- hash收集
match => { "field1" => "value1" "field2" => "value2" ...}
- 端口
port => 33
- 密码
my_password => "password"
5.3) 学习编写input的file插件input插件之input
sincedb_path:记录logstash读取位置的路径 start_postion :包括beginning和end,指定收集的位置,默认是end,从尾部开始 add_field: 加一个域 discover_internal: 发现间隔,每隔多久收集一次,默认15秒
5.4) 学习编写output的file插件
5.5) 通过input和output插件编写conf文件- 收集系统日志的conf
[root@linux-node1 ~]# cat system.conf input { file { path => "/var/log/messages" type => "system" start_position => "beginning" }}output { elasticsearch { hosts => ["192.168.56.11:9200"] index => "system-%{+YYYY.MM.dd}" }}[root@linux-node1 ~]# /opt/logstash/bin/logstash -f system.conf
- 收集elasticsearch的error日志此处把上个system日志和这个error(java程序日志)日志,放在一起。使用if判断,两种日志分别写到不同索引中.此处的type(固定的就是type,不可更改)不可以和日志格式的任何一个域(可以理解为字段)的名称重复,也就是说日志的域不可以有type这个名称。
[root@linux-node1 ~]# cat all.conf input { file { path => "/var/log/messages" type => "system" start_position => "beginning" } file { path => "/var/log/elasticsearch/chuck-cluster.log" type => "es-error" start_position => "beginning" }}output { if [type] == "system" { elasticsearch { hosts => ["192.168.56.11:9200"] index => "system-%{+YYYY.MM.dd}" } } if [type] == "es-error" { elasticsearch { hosts => ["192.168.56.11:9200"] index => "es-error-%{+YYYY.MM.dd}" } }}[root@linux-node1 ~]# /opt/logstash/bin/logstash -f all.conf
5.6) 把多行整个报错收集到一个事件中举例说明
以at.org开头的内容都属于同一个事件,但是显示在不同行,这样的日志格式看起来很不方便,所以需要把他们合并到一个事件中.
- 引入codec的multiline插件
input { stdin { codec => multiline { `pattern => "pattern, a regexp" negate => "true" or "false" what => "previous" or "next"` } }}
regrxp:使用正则,什么情况下把多行合并起来 negate: 正向匹配和反向匹配 what: 合并到当前行还是下一行 在标准输入和标准输出中测试以证明多行收集到一个日志成功
[root@linux-node1 ~]# cat muliline.conf input { stdin { codec => multiline { pattern => "^\[" negate => true what => "previous" } }}output { stdout { codec => "rubydebug" }}[root@linux-node1 ~]# /opt/logstash/bin/logstash -f muliline.conf Settings: Default filter workers: 1Logstash startup completed[1 [2{ "@timestamp" => "2016-01-15T06:46:10.712Z", "message" => "[1", "@version" => "1", "host" => "linux-node1"}chuckchuck-blog.com123456[3{ "@timestamp" => "2016-01-15T06:46:16.306Z", "message" => "[2\nchuck\nchuck-blog\nchuck-blog.com\n123456", "@version" => "1", "tags" => [ [0] "multiline" ], "host" => "linux-node1"
继续将上述实验结果放到all.conf的es-error索引中
[root@linux-node1 ~]# cat all.conf input { file { path => "/var/log/messages" type => "system" start_position => "beginning" } file { path => "/var/log/elasticsearch/chuck-clueser.log" type => "es-error" start_position => "beginning" codec => multiline { pattern => "^\[" negate => true what => "previous" } }}output { if [type] == "system" { elasticsearch { hosts => ["192.168.56.11:9200"] index => "system-%{+YYYY.MM.dd}" } } if [type] == "es-error" { elasticsearch { hosts => ["192.168.56.11:9200"] index => "es-error-%{+YYYY.MM.dd}" } }}
6) 了解 Kibana6.1) 编辑kinaba配置文件使之生效
开启一个screen,并启动kibana
[root@linux-node1 ~]# screen[root@linux-node1 ~]# /usr/local/kibana/bin/kibana注意: 使用crtl +a+d退出screen
6.2) 验证error的muliline插件生效在kibana中添加一个es-error索引
可以看到默认的字段
选择discover查看
验证error的muliline插件生效
7) Logstash收集nginx、syslog和tcp日志7.1) 收集nginx的访问日志在这里使用codec的json插件将日志的域进行分段,使用key-value的方式,使日志格式更清晰,易于搜索,还可以降低cpu的负载 更改nginx的配置文件的日志格式,使用json
启动nginx
[root@linux-node1 ~]# nginx -tnginx: the configuration file /etc/nginx/nginx.conf syntax is oknginx: configuration file /etc/nginx/nginx.conf test is successful[root@linux-node1 ~]# nginx[root@linux-node1 ~]# netstat -lntup|grep 80tcp 0 0 0.0.0.0:80 0.0.0.0:* LISTEN 43738/nginx: master tcp6 0 0 :::80 :::* LISTEN 43738/nginx: master
日志格式显示如下
使用logstash将nginx访问日志收集起来,继续写到all.conf中
将nginx-log加入kibana中并显示
7.2) 收集系统syslog日志前文中已经使用文件file的形式收集了系统日志/var/log/messages,但是实际生产环境是需要使用syslog插件直接收集 修改syslog的配置文件,把日志信息发送到514端口上
[root@linux-node1 ~]# vim /etc/rsyslog.conf 90 *.* @@192.168.56.11:514
将system-syslog放到all.conf中,启动all.conf
[root@linux-node1 ~]# cat all.conf input { syslog { type => "system-syslog" host => "192.168.56.11" port => "514" } file { path => "/var/log/messages" type => "system" start_position => "beginning" } file { path => "/var/log/nginx/access_json.log" codec => json start_position => "beginning" type => "nginx-log" } file { path => "/var/log/elasticsearch/chuck-cluster.log" type => "es-error" start_position => "beginning" codec => multiline { pattern => "^\[" negate => true what => "previous" } }}output { if [type] == "system" { elasticsearch { hosts => ["192.168.56.11:9200"] index => "system-%{+YYYY.MM.dd}" } } if [type] == "es-error" { elasticsearch { hosts => ["192.168.56.11:9200"] index => "es-error-%{+YYYY.MM.dd}" } } if [type] == "nginx-log" { elasticsearch { hosts => ["192.168.56.11:9200"] index => "nginx-log-%{+YYYY.MM.dd}" } } if [type] == "system-syslog" { elasticsearch { hosts => ["192.168.56.11:9200"] index => "system-syslog-%{+YYYY.MM.dd}" } }}[root@linux-node1 ~]# /opt/logstash/bin/logstash -f all.conf
在elasticsearch插件中就可见到增加的system-syslog索引
7.3) 收集tcp日志
编写tcp.conf
[root@linux-node1 ~]# cat tcp.conf input { tcp { host => "192.168.56.11" port => "6666" }}output { stdout { codec => "rubydebug" }}
使用nc对6666端口写入数据
[root@linux-node1 ~]# nc 192.168.56.11 6666
将信息输入到tcp的伪设备中
[root@linux-node1 ~]# echo "chuck" >/dev/tcp/192.168.56.11/6666
8) Logstash解耦之消息队列8.1) 图解使用消息队列架构
上图中,数据流向:- 数据源Datasource把数据写到input插件中;- output插件使用消息队列把消息写入到消息队列Message Queue中- Logstash indexing Instance启动logstash使用input插件读取消息队列中的信息- Fliter插件过滤后在使用output写入到elasticsearch中。如果生产环境中不适用正则grok匹配,可以写Python脚本从消息队列中读取信息,输出到elasticsearch中.
8.2 )上图架构的优点- 解耦,松耦合- 解除了由于网络原因不能直接连elasticsearch的情况- 方便架构演变,增加新内容- 消息队列可以使用rabbitmq,zeromq等,也可以使用redis,kafka(消息不删除,但是比较重量级)等.
9) 引入redis到架构中9.1) 使用redis收集logstash的信息修改redis的配置文件并启动redis
[root@linux-node1 ~]# vim /etc/redis.conf 37 daemonize yes 65 bind 192.168.56.11[root@linux-node1 ~]# systemctl start redis[root@linux-node1 ~]# netstat -lntup|grep 6379tcp 0 0 192.168.56.11:6379 0.0.0.0:* LISTEN 45270/redis-server
编写redis.conf
[root@linux-node1 ~]# cat redis-out.conf input{ stdin{}}output{ redis{ host => "192.168.56.11" port => "6379" db => "6" data_type => "list" #数据类型为list key => "demo"}
启动配置文件输入信息
[root@linux-node1 ~]# /opt/logstash/bin/logstash -f redis-out.conf Settings: Default filter workers: 1Logstash startup completedchuckchuck-blog
使用redis-cli连接到redis并查看输入的信息
[root@linux-node1 ~]# redis-cli -h 192.168.56.11192.168.56.11:6379> info #输入info查看信息# Serverredis_version:2.8.19redis_git_sha1:00000000redis_git_dirty:0redis_build_id:c0359e7aa3798aa2redis_mode:standaloneos:Linux 3.10.0-229.el7.x86_64 x86_64arch_bits:64multiplexing_api:epollgcc_version:4.8.3process_id:45270run_id:83f428b96e87b7354249fe42bd19ee8a8643c94etcp_port:6379uptime_in_seconds:1111uptime_in_days:0hz:10lru_clock:10271973config_file:/etc/redis.conf# Clientsconnected_clients:2client_longest_output_list:0client_biggest_input_buf:0blocked_clients:0# Memoryused_memory:832048used_memory_human:812.55Kused_memory_rss:5193728used_memory_peak:832048used_memory_peak_human:812.55Kused_memory_lua:35840mem_fragmentation_ratio:6.24mem_allocator:jemalloc-3.6.0# Persistenceloading:0rdb_changes_since_last_save:0rdb_bgsave_in_progress:0rdb_last_save_time:1453112484rdb_last_bgsave_status:okrdb_last_bgsave_time_sec:0rdb_current_bgsave_time_sec:-1aof_enabled:0aof_rewrite_in_progress:0aof_rewrite_scheduled:0aof_last_rewrite_time_sec:-1aof_current_rewrite_time_sec:-1aof_last_bgrewrite_status:okaof_last_write_status:ok# Statstotal_connections_received:2total_commands_processed:2instantaneous_ops_per_sec:0total_net_input_bytes:164total_net_output_bytes:9instantaneous_input_kbps:0.00instantaneous_output_kbps:0.00rejected_connections:0sync_full:0sync_partial_ok:0sync_partial_err:0expired_keys:0evicted_keys:0keyspace_hits:0keyspace_misses:0pubsub_channels:0pubsub_patterns:0latest_fork_usec:9722# Replicationrole:masterconnected_slaves:0master_repl_offset:0repl_backlog_active:0repl_backlog_size:1048576repl_backlog_first_byte_offset:0repl_backlog_histlen:0# CPUused_cpu_sys:1.95used_cpu_user:0.40used_cpu_sys_children:0.00used_cpu_user_children:0.00# Keyspacedb6:keys=1,expires=0,avg_ttl=0192.168.56.11:6379> select 6 #选择db6OK192.168.56.11:6379[6]> keys * #选择demo这个key1) "demo"192.168.56.11:6379[6]> LINDEX demo -2 #查看消息"{\"message\":\"chuck\",\"@version\":\"1\",\"@timestamp\":\"2016-01-18T10:21:23.583Z\",\"host\":\"linux-node1\"}"192.168.56.11:6379[6]> LINDEX demo -1 #查看消息"{\"message\":\"chuck-blog\",\"@version\":\"1\",\"@timestamp\":\"2016-01-18T10:25:54.523Z\",\"host\":\"linux-node1\"}"
为了下一步写input插件到把消息发送到elasticsearch中,多在redis中写入写数据
[root@linux-node1 ~]# /opt/logstash/bin/logstash -f redis-out.conf Settings: Default filter workers: 1Logstash startup completedchuckchuck-blogabcdefghijklmnopqrstuvwxyz
查看redis中名字为demo的key长度
192.168.56.11:6379[6]> llen demo(integer) 28
9.2) 使用redis发送消息到elasticsearch中编写redis-in.conf
[root@linux-node1 ~]# cat redis-in.conf input{ redis { host => "192.168.56.11" port => "6379" db => "6" data_type => "list" key => "demo"}}output{ elasticsearch { hosts => ["192.168.56.11:9200"] index => "redis-demo-%{+YYYY.MM.dd}" }}
启动配置文件
[root@linux-node1 ~]# /opt/logstash/bin/logstash -f redis-in.conf Settings: Default filter workers: 1Logstash startup completed
不断刷新demo这个key的长度(读取很快,刷新一定要速度)
192.168.56.11:6379[6]> llen demo(integer) 28192.168.56.11:6379[6]> llen demo(integer) 28192.168.56.11:6379[6]> llen demo(integer) 19 #可以看到redis的消息正在写入到elasticsearch中192.168.56.11:6379[6]> llen demo(integer) 7 #可以看到redis的消息正在写入到elasticsearch中192.168.56.11:6379[6]> llen demo(integer) 0
在elasticsearch中查看增加了redis-demo
9.3) 将all.conf的内容改为经由redis编写shipper.conf作为redis收集logstash配置文件
[root@linux-node1 ~]# cp all.conf shipper.conf[root@linux-node1 ~]# vim shipper.conf input { syslog { type => "system-syslog" host => "192.168.56.11" port => "514" } tcp { type => "tcp-6666" host => "192.168.56.11" port => "6666" } file { path => "/var/log/messages" type => "system" start_position => "beginning" } file { path => "/var/log/nginx/access_json.log" codec => json start_position => "beginning" type => "nginx-log" } file { path => "/var/log/elasticsearch/chuck-cluster.log" type => "es-error" start_position => "beginning" codec => multiline { pattern => "^\[" negate => true what => "previous" } }}output { if [type] == "system" { redis { host => "192.168.56.11" port => "6379" db => "6" data_type => "list" key => "system" } } if [type] == "es-error" { redis { host => "192.168.56.11" port => "6379" db => "6" data_type => "list" key => "es-error" } } if [type] == "nginx-log" { redis { host => "192.168.56.11" port => "6379" db => "6" data_type => "list" key => "nginx-log" } } if [type] == "system-syslog" { redis { host => "192.168.56.11" port => "6379" db => "6" data_type => "list" key => "system-syslog" } } if [type] == "tcp-6666" { redis { host => "192.168.56.11" port => "6379" db => "6" data_type => "list" key => "tcp-6666" } }}
在redis中查看keys
192.168.56.11:6379[6]> select 6OK192.168.56.11:6379[6]> keys *1) "system"2) "nginx-log"3) "tcp-6666"
编写indexer.conf作为redis发送elasticsearch配置文件
[root@linux-node1 ~]# cat indexer.conf input { redis { type => "system-syslog" host => "192.168.56.11" port => "6379" db => "6" data_type => "list" key => "system-syslog" } redis { type => "tcp-6666" host => "192.168.56.11" port => "6379" db => "6" data_type => "list" key => "tcp-6666" } redis { type => "system" host => "192.168.56.11" port => "6379" db => "6" data_type => "list" key => "system" } redis { type => "nginx-log" host => "192.168.56.11" port => "6379" db => "6" data_type => "list" key => "nginx-log" } redis { type => "es-error" host => "192.168.56.11" port => "6379" db => "6" data_type => "list" key => "es-error" } }output { if [type] == "system" { elasticsearch { hosts => "192.168.56.11" index => "system-%{+YYYY.MM.dd}" } } if [type] == "es-error" { elasticsearch { hosts => "192.168.56.11" index => "es-error-%{+YYYY.MM.dd}" } } if [type] == "nginx-log" { elasticsearch { hosts => "192.168.56.11" index => "nginx-log-%{+YYYY.MM.dd}" } } if [type] == "system-syslog" { elasticsearch { hosts => "192.168.56.11" index => "system-syslog-%{+YYYY.MM.dd}" } } if [type] == "tcp-6666" { elasticsearch { hosts => "192.168.56.11" index => "tcp-6666-%{+YYYY.MM.dd}" } }}
启动shipper.conf
[root@linux-node1 ~]# /opt/logstash/bin/logstash -f shipper.conf Settings: Default filter workers: 1
由于日志量小,很快就会全部被发送到elasticsearch,key也就没了,所以多写写数据到日志中
[root@linux-node1 ~]# for n in `seq 10000` ;do echo $n >>/var/log/elasticsearch/chuck-cluster.log;done[root@linux-node1 ~]# for n in `seq 10000` ;do echo $n >>/var/log/nginx/access_json.log;done[root@linux-node1 ~]# for n in `seq 10000` ;do echo $n >>/var/log/messages;done
查看key的长度看到key在增长
(integer) 2481192.168.56.11:6379[6]> llen system(integer) 2613192.168.56.11:6379[6]> llen system(integer) 2795192.168.56.11:6379[6]> llen system(integer) 2960
启动indexer.conf
[root@linux-node1 ~]# /opt/logstash/bin/logstash -f indexer.conf Settings: Default filter workers: 1Logstash startup completed
查看key的长度看到key在减小
192.168.56.11:6379[6]> llen nginx-log(integer) 9680192.168.56.11:6379[6]> llen nginx-log(integer) 9661192.168.56.11:6379[6]> llen nginx-log(integer) 9661192.168.56.11:6379[6]> llen system(integer) 9591192.168.56.11:6379[6]> llen system(integer) 9572192.168.56.11:6379[6]> llen system(integer) 9562
kibana查看nginx-log索引
10) 学习logstash的fliter插件10.1) 熟悉grok前面介绍了input和output插件,在这里学习fliter插件
[root@linux-node1 patterns]# pwd/opt/logstash/vendor/bundle/jruby/1.9/gems/logstash-patterns-core-2.0.2/patterns
10.2) 根据官方文档提供而编写的grok.conf
[root@linux-node1 ~]# cat grok.conf input { stdin {}}filter { grok { match => { "message" => "%{IP:client} %{WORD:method} %{URIPATHPARAM:request} %{NUMBER:bytes} %{NUMBER:duration}" } }}output { stdout { codec => "rubydebug" }}
启动logstash,并根据官方文档提供输入,可得到拆分结果如下显示
10.3) 使用logstash收集mysql慢查询日志倒入生产中mysql的slow日志,示例格式如下:
# Time: 160108 15:46:14# User@Host: dev_select_user[dev_select_user] @ [192.168.97.86] Id: 714519# Query_time: 1.638396 Lock_time: 0.000163 Rows_sent: 40 Rows_examined: 939155SET timestamp=1452239174;SELECT DATE(create_time) as day,HOUR(create_time) as h,round(avg(low_price),2) as low_price FROM t_actual_ad_num_log WHERE create_time>='2016-01-07' and ad_num<=10 GROUP BY DATE(create_time),HOUR(create_time);
使用multiline处理,并编写slow.conf
[root@linux-node1 ~]# cat mysql-slow.conf input{ file { path => "/root/slow.log" type => "mysql-slow-log" start_position => "beginning" codec => multiline { pattern => "^# User@Host:" negate => true what => "previous" } }}filter { # drop sleep events grok { match => { "message" =>"SELECT SLEEP" } add_tag => [ "sleep_drop" ] tag_on_failure => [] # prevent default _grokparsefailure tag on real records } if "sleep_drop" in [tags] { drop {} } grok { match => [ "message", "(?m)^# User@Host: %{USER:user}\[[^\]]+\] @ (?:(?
执行该配置文件,查看grok正则匹配结果
11) 生产如何上线ELK11.1) 日志分类
系统日志 rsyslog logstash syslog插件访问日志 nginx logstash codec json错误日志 file logstash file+ mulitline运行日志 file logstash codec json设备日志 syslog logstash syslog插件debug日志 file logstash json or mulitline
10.2) 日志标准化
- 路径固定标准化- 格式尽量使用json
发表评论
暂时没有评论,来抢沙发吧~