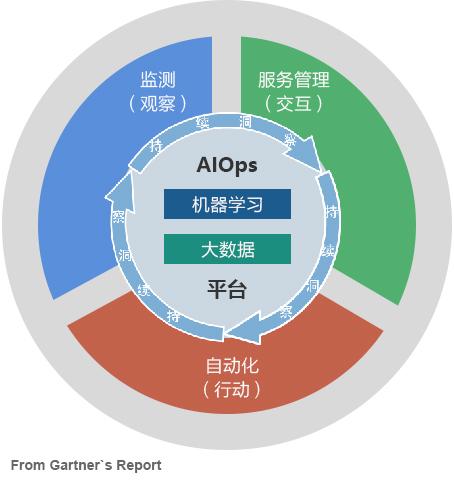
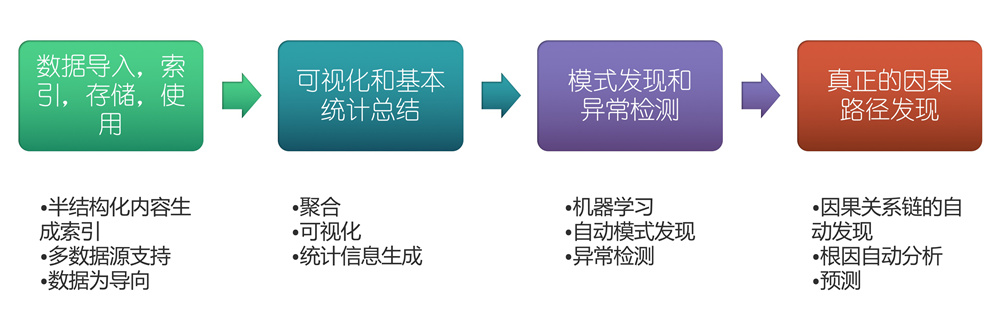
AIOps 一场颠覆传统运维的盛筵
800
2022-10-06
GBase 8a数据库集群运维巡检维护常用命令简化版
GBase 8a数据库集群,提供了多种运维监控用的命令,用来查看当前集群运行状态是否异常。也提供了简单的导入和导出方案。本文汇总了在现场运维人员最经常使用的命令汇总。
1、查看集群是否正常1.1 查看集群状态gcadmin1.2 查看集群数据不一致情况,后面可选的数字,是显示event数量,默认16个gcadmin showdmlevent [number]gcadmin showddlevent [number]gcadmin showdmlstorageevent [number]2、集群命令行,用于执行SQL命令su – gbase交互模式 gccli -uUsername -pPassword -hIP简单执行 gccli -uUsername -pPassword -hIP -e”show processlist”批量文件 gccli -uUsername -pPassword -hIP < allSQL.txt
3、查看集群运行的SQL 3.1 指定节点 简单 show processlist 完整 show full processlist 详细 show detail processlist 3.2 所有调度节点 select COORDINATOR_NAME, ID, user, host, command, start_time, time, state, substring(info,0,100) info from information_schema.COORDINATORS_TASK_INFORMATION where command=’query’ and time >=0 order by time desc limit 10;3.3 所有数据节点select NODE_NAME, ID, user, host, command, start_time, time, state, substring(info,0,100) info from information_schema.GNODES_TASK_INFORMATION where command=’query’ and info is not null and info not like ‘%information_schema.processlist%’ order by time desc limit 10;4、导出数据rmt:select * from ac08 where btime between ‘2020-01-01’ and ‘2020-02-01’ into outfile ‘/opt/ac08.txt’ fields terminated by ‘,’ ENCLOSED BY ‘”‘ null_value ‘\N’5、加载数据load data infile ‘ftp://gbase:gbase@192.168.0.100//opt/ac08.txt’ into table ac08 NULL_VALUE ‘\N’ fields terminated by ‘,’ ENCLOSED BY ‘”‘ DATETIME FORMAT ‘%Y-%m-%d %H:%i:%s’带毫秒的日期load data infile ‘ftp://gbase:gbase@192.168.0.100//opt/ac08.txt’ into table ac08 NULL_VALUE ‘\N’ fields terminated by ‘,’ ENCLOSED BY ‘”‘ DATETIME FORMAT ‘%Y-%m-%d %H:%i:%s.%f’6、查看当前加载进度select db_name,tb_name,IP,state,start_time,progress,total_size,loaded_size,loaded_records,skipped_records from information_schema.load_status order by db_name,tb_name;7、查看历史加载结果select task_id,db_name,tb_name,user,HOST_IP,start_time,end_time,elapsed_time,total_size,loaded_records,skipped_records from information_schema.load_result where start_time>’2020-07-26′ order by start_time;8、查看表、存储过程、函数show tables;show tables like ‘%XXX%’ ;show function status;show procedure status;9、查看表、函数、存储过程结构show create table mytablename;show create procedure myProc;show create function myFunc;10、查看变量show variables like ‘%XXXX%’;查看状态show status like ‘%meminfo%’;12、查看某个表占用的空间select * from information_schema.cluster_tables a where table_schema=’testdb’ and table_name=’t1′;查看每个分片的空间select * from information_schema.CLUSTER_TABLE_SEGMENTS a where table_schema=’testdb’ and table_name=’t1′;13、各种日志位置服务 进程名字 默认日志位置gcware corosync服务启停日志,只有启动和停止信息V8版本 安装目录/gcluster/log/gcluster/corosync_system.logV9版本 安装目录/gcluster/log/gcluster/gcware_system.log服务详细日志,详细的启动停止信息V8版本 /var/log/corosync.logV9版本 安装目录/gcware/log/gcware.loggcadmin命令执行日志V8版本 /var/log/gcware/gcware_XXXX.logV9版本 安装目录/gcware/liblog/gcware.loggcluster gclusterd安装目录/gcluster/log/gcluster/system.log 启停日志安装目录/gcluster/log/gcluster/express.log 引擎日志安装目录/gcluster/log/gcluster/gclusterd.log 通用日志,记录可执行的SQL命令安装目录/gcluster/log/gcluster/gclusterd-audit.log 审计日志,记录所有命令执行结果gnode gbased 安装目录/gnode/log/gbase/system.log启停日志安装目录/gnode/log/gbase/express.log引擎日志syncserver gc_sync_server安装目录/gnode/log/gbase/syncserver.log 服务日志安装目录/gnode/log/gbase/ syncclient_XXXX.log 客户端日志gcrecover安装目录/gclusger/log/gcluster/ gc_recover.log 调度日志安装目录/gclusger/log/gcluster/gcrecover_taskrecord.log 同步记录安装目录/gclusger/log/gcluster/gcrecover_system.log 启停日志gcmonit 安装目录/gclusger/log/gcluster/gcmonit.log 进程监控gcmmonit 安装目录/gclusger/log/gcluster/gcmmonit.log 进程监控的监控
文本格式GBase 8a集群运维常用命令简化版
最新版本 https://gbase8.cn/657
1、查看集群是否正常1.1 查看集群状态gcadmin1.2 查看集群数据不一致情况,后面可选的数字,是显示event数量,默认16个gcadmin showdmlevent [number]gcadmin showddlevent [number]gcadmin showdmlstorageevent [number]2、集群命令行,用于执行SQL命令su - gbase交互模式 gccli -uUsername -pPassword -hIP简单执行 gccli -uUsername -pPassword -hIP -e"show processlist"批量文件 gccli -uUsername -pPassword -hIP < allSQL.txt3、查看集群运行的SQL3.1 指定节点简单 show processlist完整 show full processlist详细 show detail processlist3.2 所有调度节点select COORDINATOR_NAME, ID, user, host, command, start_time, time, state, substring(info,0,100) info from information_schema.COORDINATORS_TASK_INFORMATION where command=‘query’ and time >=0 order by time desc limit 10;3.3 所有数据节点select NODE_NAME, ID, user, host, command, start_time, time, state, substring(info,0,100) info from information_schema.GNODES_TASK_INFORMATION where command=‘query’ and info is not null and info not like ‘%information_schema.processlist%’ order by time desc limit 10;4、导出数据rmt:select * from ac08 where btime between ‘2020-01-01’ and ‘2020-02-01’ into outfile ‘/opt/ac08.txt’ fields terminated by ‘,’ ENCLOSED BY ‘"’ null_value ‘\N’5、加载数据load data infile ‘ftp://gbase:gbase@192.168.0.100//opt/ac08.txt’ into table ac08 NULL_VALUE ‘\N’ fields terminated by ‘,’ ENCLOSED BY ‘"’ DATETIME FORMAT ‘%Y-%m-%d %H:%i:%s’带毫秒的日期load data infile ‘ftp://gbase:gbase@192.168.0.100//opt/ac08.txt’ into table ac08 NULL_VALUE ‘\N’ fields terminated by ‘,’ ENCLOSED BY ‘"’ DATETIME FORMAT ‘%Y-%m-%d %H:%i:%s.%f’6、查看当前加载进度select db_name,tb_name,IP,state,start_time,progress,total_size,loaded_size,loaded_records,skipped_records from information_schema.load_status order by db_name,tb_name;7、查看历史加载结果select task_id,db_name,tb_name,user,HOST_IP,start_time,end_time,elapsed_time,total_size,loaded_records,skipped_records from information_schema.load_result where start_time>‘2020-07-26’ order by start_time;8、查看表、存储过程、函数show tables;show tables like ‘%XXX%’ ;show function status;show procedure status;9、查看表、函数、存储过程结构show create table mytablename;show create procedure myProc;show create function myFunc;10、查看变量show variables like ‘%XXXX%’;查看状态show status like ‘%meminfo%’;12、查看某个表占用的空间select * from information_schema.cluster_tables a where table_schema=‘testdb’ and table_name=‘t1’;查看每个分片的空间select * from information_schema.CLUSTER_TABLE_SEGMENTS a where table_schema=‘testdb’ and table_name=‘t1’;13、各种日志位置服务 进程名字 默认日志位置gcware corosync服务启停日志,只有启动和停止信息V8版本 安装目录/gcluster/log/gcluster/corosync_system.logV9版本 安装目录/gcluster/log/gcluster/gcware_system.log服务详细日志,详细的启动停止信息V8版本 /var/log/corosync.logV9版本 安装目录/gcware/log/gcware.loggcadmin命令执行日志V8版本 /var/log/gcware/gcware_XXXX.logV9版本 安装目录/gcware/liblog/gcware.loggcluster gclusterd安装目录/gcluster/log/gcluster/system.log 启停日志安装目录/gcluster/log/gcluster/express.log 引擎日志安装目录/gcluster/log/gcluster/gclusterd.log 通用日志,记录可执行的SQL命令安装目录/gcluster/log/gcluster/gclusterd-audit.log 审计日志,记录所有命令执行结果gnode gbased 安装目录/gnode/log/gbase/system.log启停日志安装目录/gnode/log/gbase/express.log引擎日志syncserver gc_sync_server安装目录/gnode/log/gbase/syncserver.log 服务日志安装目录/gnode/log/gbase/ syncclient_XXXX.log 客户端日志gcrecover安装目录/gclusger/log/gcluster/ gc_recover.log 调度日志安装目录/gclusger/log/gcluster/gcrecover_taskrecord.log 同步记录安装目录/gclusger/log/gcluster/gcrecover_system.log 启停日志gcmonit 安装目录/gclusger/log/gcluster/gcmonit.log 进程监控gcmmonit 安装目录/gclusger/log/gcluster/gcmmonit.log 进程监控的监控
资料来源:https://gbase8.cn/657
发表评论
暂时没有评论,来抢沙发吧~