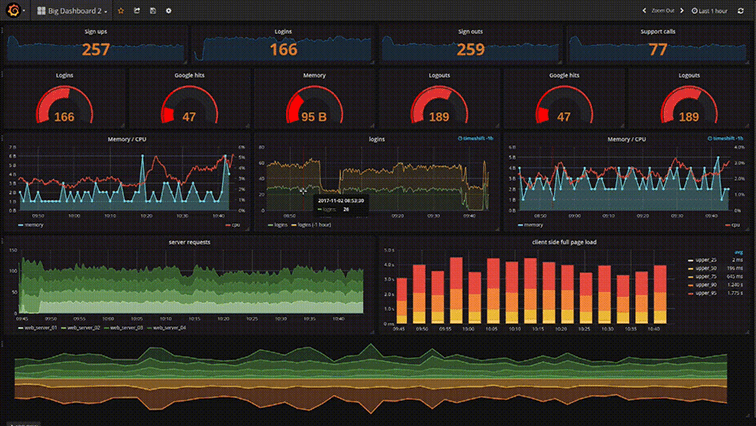
监控数据的可视化分析神器 Grafana 的告警实践
814
2022-09-27
DIY Ruby CPU 分析——Part I(第一财经)
在 Codemancers,我们正在建设 Rbkit——一个针对 Ruby 语言的——拥有新炫酷功能的代码分析器。我目前正在实现一个嵌在 rbkit gem 里的 CPU 分析器,这将有助 rbkit UI 重建分析 Ruby 进程的调用图,并在屏幕上得出有用的可视化展示。在这个过程中,我学到了许多新东西,很乐意在本系列的博客文章中与您分享。
我们打算一步一步从基础开始,专门为 Ruby 编写一个初级的 CPU 分析器!在完成时大家将学到:
Part I. 介绍 CPU 分析
通过对你的程序进行 CPU 分析,可以发现相较于 CPU 使用率,你的程序是多么宝贵。为了分析程序,你需要使用一个分析工具并按照下列步骤操作:
开始 CPU 分析执行你想要分析的代码停止 CPU 分析并得到分析结果查看分析结果通过分析结果,你会发现使整个程序运行缓慢的瓶颈。
分析模式
CPU 分析可以分为以下两种方法:
1. 工具
在这种模式下,分析工具利用一些 hooks,由解释器提供或者插入程序中,来了解调用图并测量在调用图中每个方法的执行时间。举个例子,看一下下面这段 Ruby 代码:
def main 3.times do find_many_square_roots find_many_squares end end
def find_many_square_roots 5000.times{|i| Math.sqrt(i)}end
def find_many_squares 5000.times{|i| i**2 }end
main
已经插入了一些内容,来帮助了解如果 Ruby 解释器给了我们方法的调用和返回的 hooks,它们如何执行:
def main # method call hook gets executed 3.times do find_many_square_roots find_many_squares end # method end hook gets executedend
def find_many_square_roots # method call hook gets executed 5000.times{|i| Math.sqrt(i)} # method end hook gets executedend
def find_many_squares # method call hook gets executed 5000.times{|i| i**2 } # method end hook gets executedend
main
现在,如果能够打印出当前时间和这些 hooks 内部当前方法的名称,会得到看起来像这种形式的输出结果:
sec:00 usec:201007 called main sec:00 usec:201108 called find_many_square_roots sec:00 usec:692123 returned find_many_square_roots sec:00 usec:692178 called find_many_squares sec:00 usec:846540 returned find_many_squares sec:00 usec:846594 called find_many_square_roots sec:01 usec:336166 returned find_many_square_roots sec:01 usec:336215 called find_many_squares sec:01 usec:484880 returned find_many_squares sec:01 usec:484945 called find_many_square_roots sec:01 usec:959254 returned find_many_square_roots sec:01 usec:959315 called find_many_squares sec:02 usec:106474 returned find_many_squares sec:02 usec:106526 returned main
正如你所看到的,此输出可以告诉我们在每一种方法里面花了多长时间。同时也告诉我们,每一个方法调用的次数。这大概就解释了性能分析工具是如何工作的。
优点:
高精度我们得到了方法调用数易于实施
缺点:
每个被分析的方法执行 hooks 时的额外开销
2. 采样
在采样模式下,分析器每隔 x 时间单元打断一次程序,并查看调用堆并记录它的信息(被称为“样品”)。一旦该程序完成运行,分析器收集所有样品并找出每个方法出现在所有样品中的次数。很难想象?让我们来看看同样的例子代码,看看如果我们使用采样分析器,输出结果会有怎样的不同。采样分析器的输出结果如下:
Call stack at 0.5sec: main/find_many_square_roots Call stack at 1.0sec: main/find_many_square_roots Call stack at 1.5sec: main/find_many_square_roots Call stack at 2.0sec: main/find_many_squares
在这个例子中,程序每 0.5 秒被中断一次并且调用堆栈被记录。因此,通过这个程序执行的过程得到了 4 个样品,find_many_square_roots记录于 3 个样品中, find_many_squares 只存在于一个样品中。从本次采样中,可以得到 find_many_square_roots占用了 75% CPU,与此同时find_many_squares只占用了 25% 的 CPU 。这就大概解释了分析器是怎么样工作的。
优点:
与工具分析相比开销可忽略不计很容易找到缓慢/长时间运行的方法
缺点:
不擅长测量短时间运行的方法没有得到方法调用数很难自己写出采样分析器
概括
第 1 部分只是调查了 CPU 分析的含义和两种常用的 CPU 分析方法。在第 2 部分,我们将探讨对描述 CPU 使用情况的 2 个单位进行测量—— CPU Time 和 Wall Time,与此同时,也会亲手写一些代码来获取进行测量。感谢您的阅读!


发表评论
暂时没有评论,来抢沙发吧~