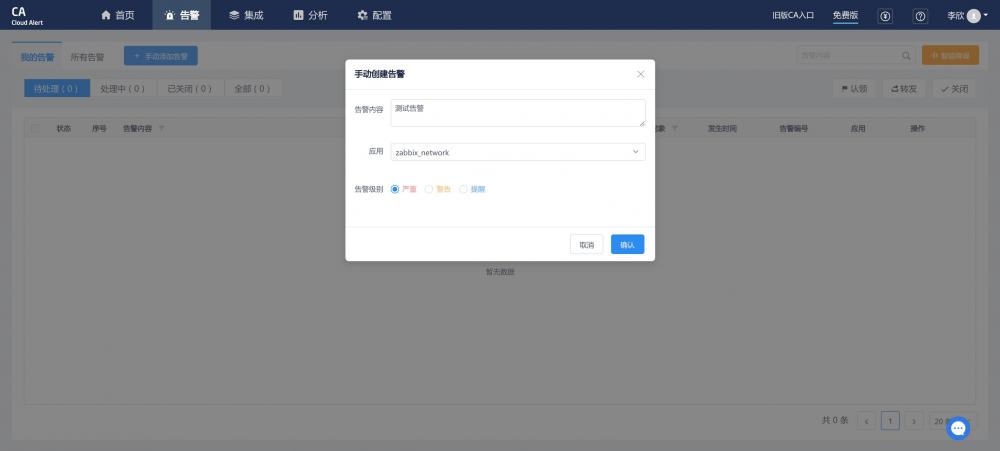
如何在智能告警平台CA触发测试告警
627
2022-09-12
DIY Ruby CPU 分析——Part III(diy手工制作大全)
Part III. DIY 仪表 CPU 分析器
Ruby 的仪表盘
TracePoint API
执行代码时,Ruby VM 发送一系列事件到不同的节点。Ruby 允许利用TracePoint类进行事件回调。TracePoint的 API 文档列出了所有可以监听的事件,但我们只对下面两个感兴趣:
:call,当 Ruby 方法调用时被触发。 :return, 当 Ruby 方法返回时被触发。 我们可以通过TracePoint.new方法创造 tracepoint 对象并传递一个事件类型进行监听,同时传递部分在事件触发时执行的代码。下面是为:call和:return事件创造 tracepoint 的代码。
trace = TracePoint.new(:call, :return) do |trace| puts "Method: #{trace.method_id}, event: #{trace.event}"end
被传到回调代码块的参数trace使你能够访问一系列 tracepoint 的属性,通过它们更加了解被触发的事件。举个例子,我们需要通过method_id属性得到 method name,通过event属性得到被触发的事件名。上文提到的回调代码块中将显示出方法名和被触发的事件类型,每一次都会伴随着 Ruby 方法的调用或返回。建立 tracepoint 之后,需要将其变成可用状态:
trace.enable
一旦 tracepoint 变成可用状态,我们便可以创建方法对它进行调用,并且看我们出发的回调命令是否被执行。
def hello endhello#=> Method: hello, event: call#=> Method: hello, event: return
不错,我们的回调命令如预期的一样被执行了两次。
diy_prof gem
bundle gem diy_prof
这就造出了我们将要做的项目的骨架。接着,我们将建立在 Part II 中介绍过的包含cpu_time和wall_time方法的 TimeHelpers模块:
# lib/diy_prof/time_helpers.rbmodule DiyProf::TimeHelpers # These methods make use of `clock_gettime` method introduced in Ruby 2.1 # to measure CPU time and Wall clock time. def cpu_time Process.clock_gettime(Process::CLOCK_PROCESS_CPUTIME_ID, :microsecond) end def wall_time Process.clock_gettime(Process::CLOCK_MONOTONIC, :microsecond) endend
我们还需要请求 gem 主文件中的这个文件lib/diy_prof.rb:
# lib/diy_prof.rbrequire 'diy_prof/version' require 'diy_prof/time_helpers' # Rest of the original file ..
下一步,当一个:call或return事件发生时,我们将通过 gem 里的 TracePoint API 来显示时间。
module DiyProf class Tracer include TimeHelpers def initialize(clock_type: :cpu) @tracepoint = TracePoint.new(:call, :return) do |trace| time = clock_type == :wall ? wall_time : cpu_time printf("%-20s:%-20s%-20s\n", time, trace.event, trace.method_id) end end def enable @tracepoint.enable end def disable @tracepoint.disable end endend
同时,我们需要再一次调用这个 gem 主文件中的文件:
# lib/diy_prof.rbrequire 'diy_prof/version' require 'diy_prof/time_helpers' require 'diy_prof/tracer' # Rest of the original file ..
现在,让我们来写一个例子脚本来测试至今为止创造了什么。我们将使用在 Part I 中见过的那个例子:
# examples/demo.rb$:<< File.join(File.dirname(__FILE__), "../lib")require 'diy_prof'### Begin sample program ###def main 3.times do find_many_square_roots find_many_squares endenddef find_many_square_roots 5000.times{|i| Math.sqrt(i)}enddef find_many_squares 5000.times{|i| i**2 }end ### End sample program ###tracer = DiyProf::Tracer.new(clock_type: :cpu) tracer.enable main tracer.disable
概括
我们学习了 Ruby 的 TracePoint API 以及如何用它监听方法的调用和返回。同时我们整合写过的代码建立了一个能够显示 Ruby 程序的执行 trace 的 gem。在第四部分我们将学习如何有效利用 gem 收集到的数据并通过它们创造一些很酷的调用图。感谢阅读!如果你想要阅读 DIY CPU 分析系列的其他最新文章,请关注我们的 twitter @codemancershq.
发表评论
暂时没有评论,来抢沙发吧~