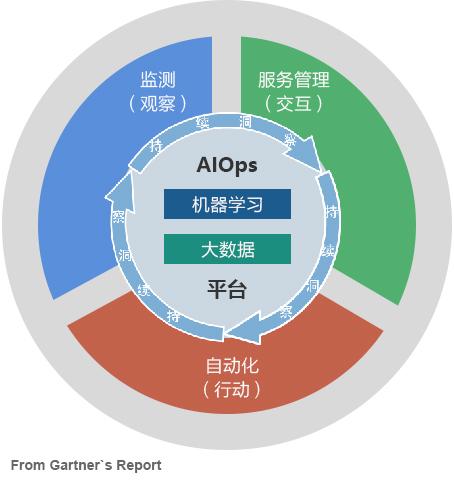
AIOps 一场颠覆传统运维的盛筵
696
2022-09-12
DIY Ruby CPU 分析——Part IV(diy手工制作大全)
Part IV. 调用图
Graphviz 和 DOT 语言
digraph graph_name { a -> b -> c; b -> d;}
保存上述几条作为一个样本,dot 并运行下列命令。
dot -Tpdf sample.dot -o graph.pdf
digraph graph_name {
因此下列 DOT 符号代表同样的图:
digraph graph_name { a; b; c; d; a -> b; b -> c; b -> d;}
还可以为节点和关系添加附加标签。
digraph graph_name { a [label="a \n foo: bar"]; b [label="b \n foo: baz"] a -> b [label="xyz"];}
Graphviz 调用图
我们想要为我们的 DiyProf gem 创造一个报告类,通过它来持续收集所有方法调用并创造一个 DOT 文件来代表调用图。我们将在进入 DotReporter 类下面添加一个 record方法,DotReporter 类能够在调用发生时推送方法信息进堆,在方法返回时从堆中抛出方法信息。当方法信息被从堆中抛出,它在堆中花费的时间则被记录,并且向调用树添加方法调用信息。看下列代码:
module DiyProf # Struct that will hold a method name and a timestamp CallInfo = Struct.new(:name, :time) class DotReporter def initialize # A stack for pushing/popping methods when methods get called/returned @call_stack = [] # Nodes for all methods @methods = {} # Connections between the nodes @calls = {} end def record(event, method_name, time) case event when :call @call_stack << CallInfo.new(method_name, time) when :return # Return cannot be the first event in the call stack return if @call_stack.empty? method = @call_stack.pop # Set execution time of method in call info method.time = time - method.time add_method_to_call_tree(method) end end endend
```# Struct that holds the time spent in a method# and the total number of times a method was calledMethodInfo = Struct.new(:count, :total_time, :self_time)def add_method_to_call_tree(method) # Add method as a node to the call graph @methods[method.name] ||= MethodInfo.new(0, 0, 0) # Update total time(spent inside the method and methods called inside this method) @methods[method.name].total_time += method.time # Update self time(spent inside the method and not methods called inside this method) # This will be subtracted when children are added to the graph @methods[method.name].self_time += method.time # Update total no of times the method was called @methods[method.name].count += 1 # If the method has a parent in the call stack # Add a connection from the parent node to this method if parent = @call_stack.last @calls[parent.name] ||= {} @calls[parent.name][method.name] ||= 0 @calls[parent.name][method.name] += 1 # Take away self time of parent @methods[parent.name] ||= MethodInfo.new(0, 0, 0) @methods[parent.name].self_time -= method.time endend
现在我们在@methods和@calls中都有节点和关系了,可以但不是必须要生成一个如下的文件:
digraph G {
下面是将在@methods和@calls中出现的代码,准备如下的 DOT 文件:
def dot_notation dot = %Q( digraph G { #{graph_nodes} #{graph_links} } )enddef graph_nodes nodes = "" @methods.each do |name, method_info| nodes << "#{name} [label=\"#{name}\\ncalls: #{method_info.count}\\ntotal time: #{method_info.total_time}\\nself time: #{method_info.self_time}\"];\n" end nodesenddef graph_links links = "" @calls.each do |parent, children| children.each do |child, count| links << "#{parent} -> #{child} [label=\" #{count}\"];\n" end end linksend
在 github repo 上检查lib/diy_prof/dot_reporter.rb文件,看看它们是怎样彼此配合的。我们同时还需要利用规定的报告类在第三部分写过的 Tracer 类中做一些改变:
module DiyProf class Tracer # We'll need to initialize the Tracer with DotReporter.new def initialize(reporter) @reporter = reporter @tracepoints = [:call, :return].collect do |event| TracePoint.new(event) do |trace| # Use the reporter instead of just printing the traces reporter.record(event, trace.method_id, cpu_time) end end end ... # New method added to collect the report after profiling def result @reporter.result end endend
现在我们的 tracer 能够生成 DOT 格式的报告了,我们将它用在先前部分中写过的样本程序上:
def main 3.times do find_many_square_roots find_many_squares endenddef find_many_square_roots 5000.times{|i| Math.sqrt(i)}enddef find_many_squares 5000.times{|i| i**2 }endDiyProf.start_profiling main result = DiyProf.stop_profilingrequire 'tempfile' f = Tempfile.open('dot') f.write result f.close system("dot -Tpdf #{f.path} -o call_graph.pdf")
额外令人开心的事!
如果能基于本身或方法总时间区分节点大小岂不是很酷?DOT 语法允许节点和 edges 拥有一系列属性。就像我们可以用size和fontsize属性来区分节点和节点内的内容。我将把如何用过这些来使最重要的方法在调用图中着重显示,这个问题将留给你们。
概括
我们学习了关于 Graphviz 和 DOT 语言及如何它们创造基于 Ruby TracePoint API 收集到的数据的调用图表。在第五部分,我们将着手建立一个简单的 RUby 分析器,尤其会学到一些基本的 C 里的信号中断和处理。感谢阅读,如果想要获取关于 DIY CPU 分析系列的最新博客内容,请关注我们的推特 @codemancershq.
发表评论
暂时没有评论,来抢沙发吧~